Joe Zidle: The End of Liquidity Is a New Beginning for Alpha
In 1998, the band Semisonic released the song “Closing Time.” It became an unofficial anthem for many a young college grad, and almost 25 years later, the song is still played in bars everywhere at last call thanks to its timeless message: “You don’t have to go home but you can’t stay here…” It’s the final line of the song, “every new beginning comes from some other beginning’s end,” that reveals a deeper meaning, one about life’s transitions.
I remember thinking that Semisonic must be intellectual heavyweights. But that line is attributed to a first-century Roman philosopher, Seneca the Younger. Seneca’s deceptively simple idea, that every end leads to a new beginning, is relevant to understanding the volatility across asset classes in the last 12 months: The end of a liquidity cycle is the beginning of a coordinated global tightening cycle.
While it is daunting to think that the days of easy money and the “everything rally” are over, this ending marks the start of a new environment that will come with its own opportunities. The new environment will feature dispersion across asset classes, portfolio performance, companies and sectors. It will require a different approach than the traditional 60/40 portfolio of stocks and bonds. More broadly, it will require creativity, high-conviction investing and a renewed look for uncorrelated assets. If ultra-low interest rates and balance sheet expansion benefited beta strategies, monetary tightening will require more active, selective investing, i.e., alpha, to deliver outperformance.
Don’t Assume This Cycle Is Like the Last Cycle
China a differentiating factor for inflation this time Moving forward, will rates fall back into the post-recession pattern we’ve seen since 1980, or will they revert to the earlier trend? History says it’s close to a 50/50 proposition, but I think there is reason to believe that the 10-year Treasury yield after the next recession will be higher than it is today.
A primary reason for this view is that the underlying inflationary conditions in the US and global economy seem to be more persistent, due in large part to China’s demographics. China is widely credited with driving down prices as its economy grew from low-income to middle income. That leap forward occurred as China benefited from favorable demographics. But a negative replacement ratio and a falling prime age working population fundamentally change China’s role on the manufacturing stage. When China had a labor surplus, it drove costs down. But with its current labor deficit, China’s role as the preeminent low-cost, global manufacturer is being reevaluated. Figure 1 highlights China’s demographic challenge.
Figure 1: China’s Working Age Population (People Aged 15-64)
(in billions)
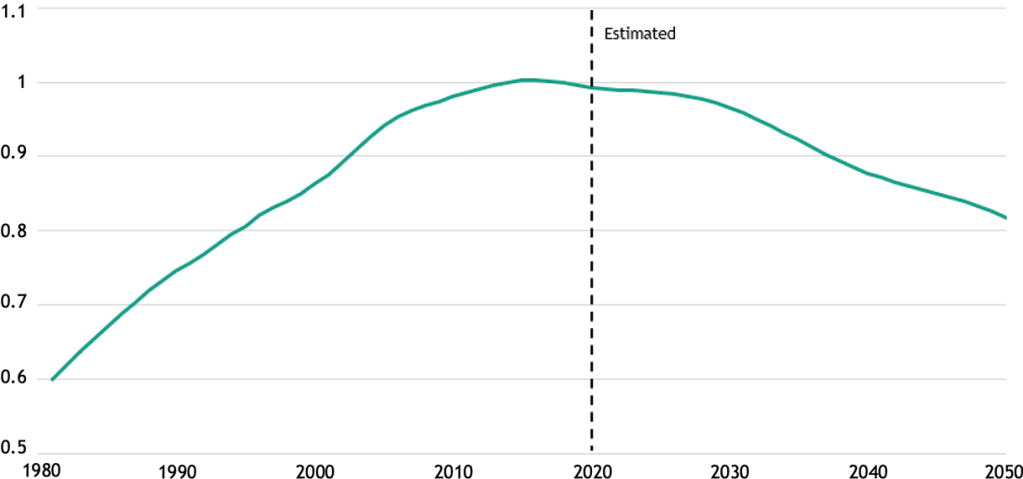
Source: World Bank and the UN, actual data as of 2020. Data for 2021 and beyond are estimates.
In my view, increased costs in the supply chain, elevated commodity prices that I think could be long-lasting, and widespread labor shortages argue for interest rates to settle at levels structurally higher than the levels of the prior cycle.
Liquidity = Beta
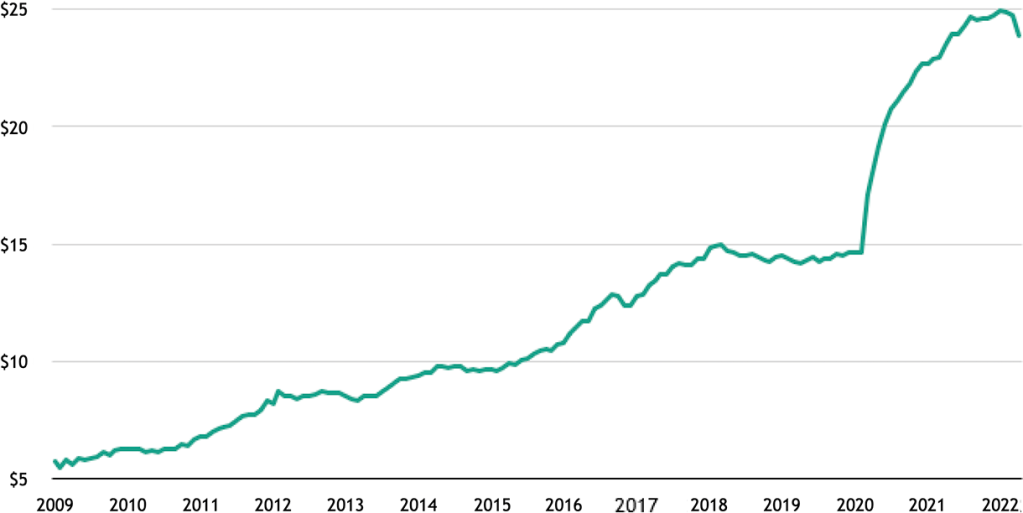
That prior cycle was defined by unprecedented monetary stimulus. As Figures 2 and 3 show, from the end of the Global Financial Crisis in 2009 until now, the combined balance sheets of the Fed, European Central Bank and the Bank of Japan grew from approximately $5.3 trillion to over $23.7 trillion. That persistent central bank accommodation pushed interest rates to a 5,000-year low. Liquidity on that scale provided a massive boost to beta factors.
Figure 2: Central Bank Balance Sheet Assets: Federal Reserve, ECB, and BoJ
(USD in trillions)
Source: World Bank and the UN, actual data as of 2020. Data for 2021 and beyond are estimates.
Figure 3: History of Global Short- and Long-Term Interest Rates
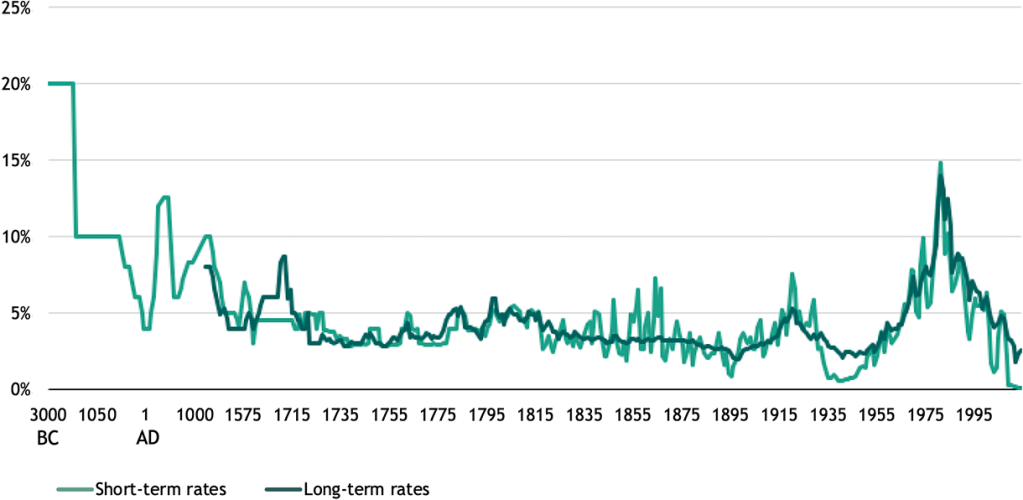
Source: Homer and Sylla (1991), Heim and Mirowski (1987),Weiller and Mirowski (1990), Hills, Thomas and Dimsdale (2015 forthcoming), Bank of England, Historical Statistics of the United States Millenial Edition, Volume 3 and Federal Reserve Economic Database. Note the intervals on the x-axis change through time up to 1715. From 1715 onwards the intervals are every twenty years.
2009–2021: Beta’s stars aligned Record-high profit margins and multiple expansion, fueled by low interest rates, combined to produce the biggest bull market in history. Corporate profit margins increased from 4.3% in the first quarter of 2009 to an all-time high of 13.3% in the fourth quarter of 2021 (see Figure 4).1 The amount of money investors in the S&P 500 paid for each dollar of earnings nearly doubled from 12.1x earnings in February 2009 to a multiple of 23x earnings in January 2022.2 Performance followed: the S&P 500 returned over 17% on an annualized basis from February 2009 through January 2022; the Russell 2000 averaged 15% and the Nasdaq an impressive 21%.3 Each index handily beat its historic average returns.
Figure 4: S&P 500 Net Profit Margins
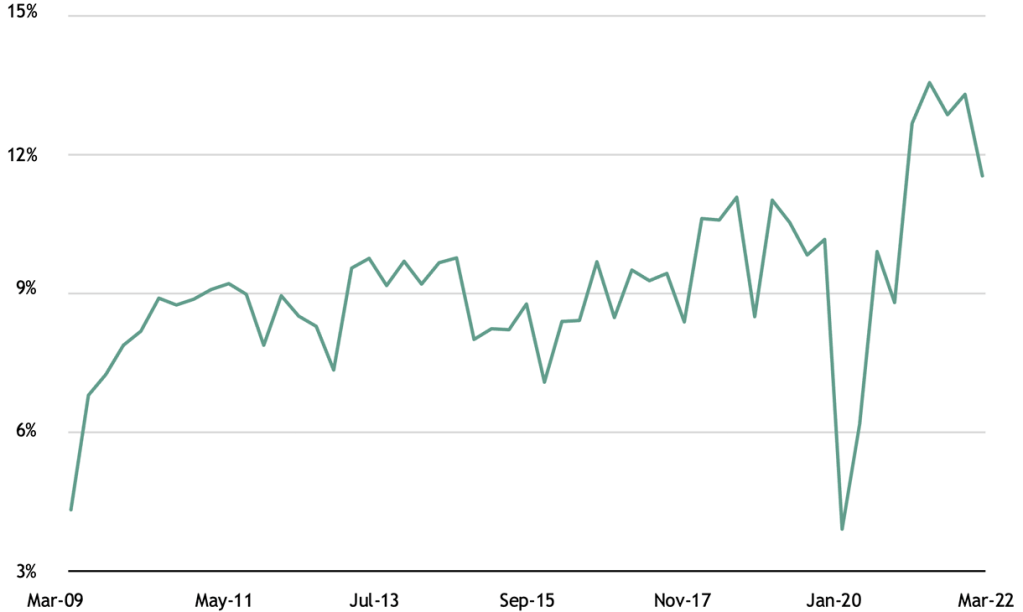
Source: S&P Capital IQ, as of 3/31/2022.
Investors in fixed income enjoyed similarly high returns as a result of these beta factors. The Bloomberg US aggregate bond index benefited from a 40-year bond bull market since inflation last reared its ugly head in the early 1980s. And in the last cycle, liquidity muted corporate bankruptcy risk. Credit spreads narrowed as financial conditions eased. Corporate bond spreads on the safest investment grade bonds peaked at nearly 14% in 1984, before declining steadily over the following decades to a record low 2.0% in July 2020. A traditional portfolio consisting of 60% stocks and 40% bonds returned 10.7% per annum from 2010 through the end of 2021.4
Tightening = Alpha
Low interest rates and balance sheet expansion created a seemingly unending positive feedback loop for market beta. Good news was good for returns. Bad news was even better. And the worst news of all—a global pandemic—proved the best environment of all for market returns as each recession begot lower rates and easier monetary policy. Now that central banks around the world are on track to hike rates more than 250 times this year while shrinking their balance sheets, those same beta exposures won’t similarly outperform.5
Different conditions call for a different mindset Return assumptions across all asset classes should be dialed back from those of the last cycle. I think a reasonable forward 10-year CAGR assumption for US equity returns is something in the 5% range—around 8% nominal earnings growth. And instead of multiple expansion, we should discount returns for a compression from today’s above-average levels. Interest rates that settle higher than the last couple cycles means investors in traditional fixed income will be clipping coupons, not enjoying the outsized returns from the secular bond bull market of the past 40 years.
To achieve outperformance, higher-conviction investing and more active management will be needed to make up for returns from beta alone.
Investing in This New Cycle
Investing in good neighborhoods, those companies and sectors with secular growth tailwinds, will be more important than ever. Free cash flow generation, and a runway to increase it, will be critical as inflation remains a concern for longer. Relying on market beta alone will likely be inadequate to meet many investors’ return expectations. Active management and operational expertise are more likely to drive outperformance than financial engineering alone, and I think investors will benefit from paying a premium for these qualities.
In a fixed income book, this environment will be one in which credit risk is re-introduced as an important consideration. In an era of seemingly unlimited liquidity, the number of non-earning companies skyrocketed, even as credit risk remained historically low. In the face of increased credit risk, senior secured debt and investments that are higher in the capital structure could be well positioned to weather a potential storm. While default rates are still generally expected to be below the historical average in the coming years, I would say that interest rate and credit risk are more evenly balanced than in the past several years. The risk is more skewed to the downside than the upside for both risk factors.
As financial conditions continue to tighten, traditional fixed income may remain positively correlated to stocks. As Figure 5 highlights, the correlation between bonds and stocks is highly variable, depending on the macroeconomic environment. In the late 1970s and the 1980s, they had a strong positive correlation, and since then the relationship has been highly cyclical. Rising interest rates and persistent inflation should prompt investors to reconsider what a “core” portfolio should be.
Figure 5: Stock / Bond Correlation
(rolling 5-year average)

Source: Blackstone Investment Strategy, Ibbotson Associates and Morningstar Direct, as of 5/21/22. The stock/bond correlation represents the rolling 5-year average of the correlation between the S&P 500 Index and the Ibbotson Associates Long Treasuries Index. Weekly observations; each year assumed to comprise 50 weeks
Lastly, I remain of the view that duration risk across all asset classes will be a critical factor in determining performance.
What it means for markets: a new beginning for alpha The markets were awash in liquidity over the past decade, and the rising tide lifted virtually all financial assets. Now, as the liquidity recedes, we will see which investors were simply riding the wave of beta without any value-add of their own. Divesting from beta-reliant strategies and pivoting towards alpha generation may prove to be a defining driver of outperformance in this cycle.
With data and analysis by Taylor Becker.
- Source: S&P Capital IQ, as of 3/31/2022.
- Source: Bloomberg. Represents the total return of the S&P 500 Index, Russell 2000 Index and NASDAQ Composite Index, for the time period 2/27/2009 through 1/31/2022.
- Source: Bloomberg. Represents the total return of the S&P 500 Index, Russell 2000 Index and NASDAQ Composite Index, for the time period 2/27/2009 through 1/31/2022.
- Source: Blackstone Investment Strategy calculations and Bloomberg. Represents a model portfolio that is allocated 60% to the S&P 500 Index and 40% to the Bloomberg US Aggregate Bond Index, rebalanced annually, for the period 12/31/2009 to 12/31/2021.
- Source: BofA Global Investment Strategy, as of 5/5/2022.
The views expressed in this commentary are the personal views of Joe Zidle and do not necessarily reflect the views of Blackstone Inc. (together with its affiliates, “Blackstone”). The views expressed reflect the current views of Joe Zidle as of the date hereof, and neither Joe Zidle or Blackstone undertake any responsibility to advise you of any changes in the views expressed herein.
Blackstone and others associated with it may have positions in and effect transactions in securities of companies mentioned or indirectly referenced in this commentary and may also perform or seek to perform services for those companies. Blackstone and others associated with it may also offer strategies to third parties for compensation within those asset classes mentioned or described in this commentary. Investment concepts mentioned in this commentary may be unsuitable for investors depending on their specific investment objectives and financial position.
Tax considerations, margin requirements, commissions and other transaction costs may significantly affect the economic consequences of any transaction concepts referenced in this commentary and should be reviewed carefully with one’s investment and tax advisors. All information in this commentary is believed to be reliable as of the date on which this commentary was issued, and has been obtained from public sources believed to be reliable. No representation or warranty, either express or implied, is provided in relation to the accuracy or completeness of the information contained herein.
This commentary does not constitute an offer to sell any securities or the solicitation of an offer to purchase any securities. This commentary discusses broad market, industry or sector trends, or other general economic, market or political conditions and has not been provided in a fiduciary capacity under ERISA and should not be construed as research, investment advice, or any investment recommendation. Past performance is not necessarily indicative of future performance.
For more information about how Blackstone collects, uses, stores and processes your personal information, please see our Privacy Policy here: www.blackstone.com/privacy. You have the right to object to receiving direct marketing from Blackstone at any time. Please click the link above to unsubscribe from this mailing list.