Joe Zidle: The Rounders Playbook for the 10-Year Treasury Yield
At a Glance
- Divergence of the current 10-year Treasury yield from its fair value
- Rising term premium amid quantitative tightening and heightened uncertainty
- Investment allocation in a liquidity-scarce environment
In my experience, financial analysts often vie for attention more than accuracy when forecasting extreme market conditions, be they bearish or bullish, hawkish or dovish. This phenomenon recently gripped the Treasury markets as the 10-Year Treasury yield surged to levels not seen since 2007. Analysts seemed to engage in a game of “call and raise,” much like the poker duel between Mike McDermott and Teddy KGB in the final scene of the 1998 classic film Rounders. Their yield forecasts for the 10-Year Treasury escalated rapidly—5%, then 6%, and finally, someone went all-in with a bold 7% target.
I fold in these games in favor of looking for tells in the data, including data that pre-dates the Global Financial Crisis (GFC). As Teddy said following McDermott’s winning hand, “All night, he ‘Check. Check. Check.’ He trap me.” But McDermott didn’t do so blindly. He spotted Teddy’s Oreo cookie tell, benchmarked it against previous hands, and adjusted his strategy accordingly. With multiple factors suggesting the 10-year yield is likely to remain elevated, I believe investors must do the same with asset allocation in this environment.
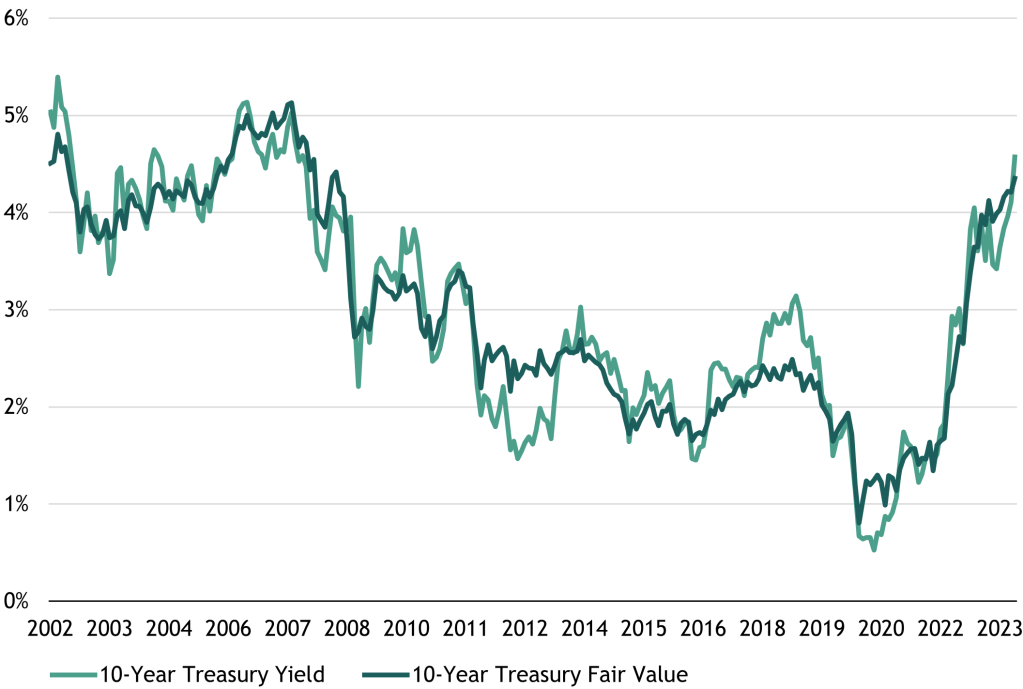
Establishing fair value Our analysis suggests that at 4.6% the 10-year yield is trading above its fair value, which we estimate at 4.4%. Our valuation model below focuses on the 5-year US Treasury breakeven rate, the 6-month US Treasury bill yield, the VIX index, and 10-year nominal German sovereign bond yields.
FIGURE 1: US 10-YEAR TREASURY FAIR VALUE
(January 2002 to September 2023)

Markets don’t always align perfectly with fair value, but understanding the fundamentals that underpin market prices can help mitigate emotional biases that often cloud judgment, such as fear and greed, hope and denial. Several factors suggest that the fair value of the 10-year will remain elevated, such as ongoing economic resilience and larger bond issuances meeting increasingly tepid demand. Another factor is the rising term premium.
The term premium reenters the discussion Fundamentally, the term premium represents the additional compensation an investor requires to hold a bond amid greater interest rate uncertainty. But the term premium is somewhat controversial because it’s not directly measurable like a price level or a tangible good. It’s only indirectly observable through the differences between actual bond yields and the expected path of future short-term interest rates. The various methodologies used for measuring it add to the confusion.
In the era of low rates and quantitative easing (QE), the term premium took a backseat. The Fed’s promises and balance sheet expansion effectively negated interest rate risk, and the term premium fell below zero. As an old mentor once told me, “If you have a problem that can be solved with money, then it’s not a problem.” QE ensured that the term premium was no longer an issue, allowing the Fed to maintain ultra-low rates.
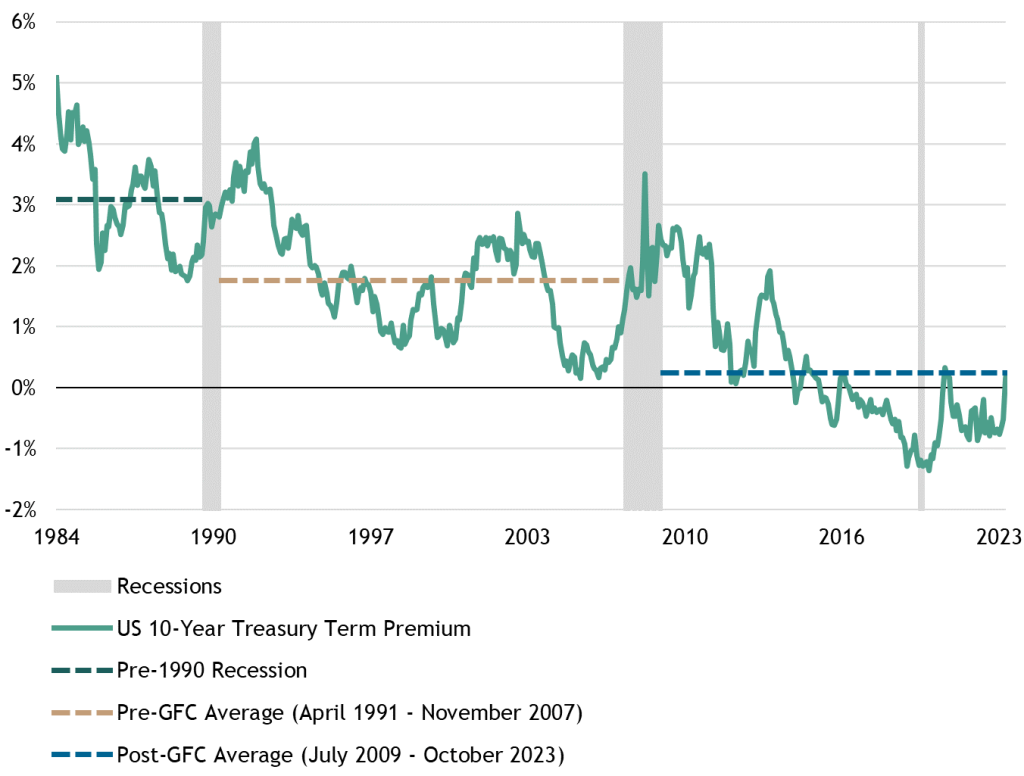
As US and global yields rose to their highest levels in two decades in 2023, the term premium entered positive territory. With increased uncertainties about rates and inflation, the term premium is likely to remain elevated in the near term. The chart below highlights the term premium across various cycles and the stark difference before and after the Global Financial Crisis. The term premium averaged 308 basis points (bps) prior to the 1990 recession, decreased to 175 bps leading up to the GFC and fell to 24 bps in its aftermath.
FIGURE 2: US 10-YEAR TREASURY TERM PREMIUM

What Got Us Here Won’t Get Us There Portfolios using the traditional 60/40 approach faced challenges in 2022, and in recent weeks the reemergence of a positive stock-bond correlation challenged them again. The correlation between stocks and bonds is heavily influenced by the level of interest rates; in higher rate environments the correlation tends to be positive, and vice versa.
A recurring theme in our discussions over the last two years has been the transition from a liquidity-rich environment to one of scarcity, from QE to QT (quantitative tightening). An unintended consequence is the destabilization of the 10-year Treasury, traditionally the foundation of finance. The yield surge looms large over portfolio construction while also highlighting the fragile state of the economy.
The QE era of easy money may no longer be the right reference point for asset allocation. Investors must recognize that the economy, policymakers, and the markets are dealing them different hands now and that they must reassess their strategies. Among other considerations, I believe prioritizing profits over multiples and credit over duration is vital to navigating this liquidity drought.
The views expressed in this commentary are the personal views of Joe Zidle and do not necessarily reflect the views of Blackstone Inc. (together with its affiliates, “Blackstone”). The views expressed reflect the current views of Joe Zidle as of the date hereof, and neither Joe Zidle nor Blackstone undertake any responsibility to advise you of any changes in the views expressed herein.
Blackstone and others associated with it may have positions in and effect transactions in securities of companies mentioned or indirectly referenced in this commentary and may also perform or seek to perform services for those companies. Blackstone and others associated with it may also offer strategies to third parties for compensation within those asset classes mentioned or described in this commentary. Investment concepts mentioned in this commentary may be unsuitable for investors depending on their specific investment objectives and financial position.
Tax considerations, margin requirements, commissions and other transaction costs may significantly affect the economic consequences of any transaction concepts referenced in this commentary and should be reviewed carefully with one’s investment and tax advisors. All information in this commentary is believed to be reliable as of the date on which this commentary was issued, and has been obtained from public sources believed to be reliable. No representation or warranty, either express or implied, is provided in relation to the accuracy or completeness of the information contained herein.
This commentary does not constitute an offer to sell any securities or the solicitation of an offer to purchase any securities. This commentary discusses broad market, industry or sector trends, or other general economic, market or political conditions and has not been provided in a fiduciary capacity under ERISA and should not be construed as research, investment advice, or any investment recommendation. Past performance is not necessarily indicative of future performance.
For more information about how Blackstone collects, uses, stores and processes your personal information, please see our Privacy Policy here: www.blackstone.com/privacy.


