Joe Zidle: Waking from the Slumber
“It’s morning again in America” President Reagan’s iconic political ad captivated a nation in 1984. The message endures, though not necessarily for its political impact; Reagan was already positioned for victory. Rather, it has remained relevant because of the emotional chord it struck. Reagan challenged a generation scarred by runaway inflation and a blistering double-dip recession to look forward to the future with confidence.
Today, nearly 95% of the US economy by GDP is in the process of reopening from the pandemic shutdown.(1) Better times are ahead as the economy wakes up from its forced slumber. Many companies are resuming limited operations and recalling workers. And many of us will soon venture out for the first time in months and begin rebuilding the economy, one exchange at a time. We will do so with greater attention to personal space. We will wear masks and gloves. We will subject ourselves to thermal imaging and antigen testing. We may even have our contacts traced.
It will be a gargantuan effort to keep people safe from a danger that hides among us, around corners, on door handles and down grocery store aisles. Many of the measures taken to flatten the COVID-19 curve will have long-lasting effects on economic growth and consumer behaviors, and significant investment implications. Prakash Melwani, CIO of Blackstone’s Private Equity business, recently called the phase we’re entering the “next new normal.” It’s an apt description. Here’s what we expect.
A Slow Recovery
The recovery from this recession will be slow, and slower than many want to believe. Asia, having dealt with the virus first, has a head start on the rest of the world. The US is the next major economy to begin its recovery. Europe, Japan and many other emerging markets are likely to trail. Despite the dynamism of the US economy relative to this latter group, we do not expect the recovery to resemble anything like a “V-shape.” My partner Byron and I see a “square root” recovery, characterized by 1) the initial sharp drop that we have already experienced; 2) a sharp, but smaller, bounce back to a lower level; and 3) a long, flat recovery.
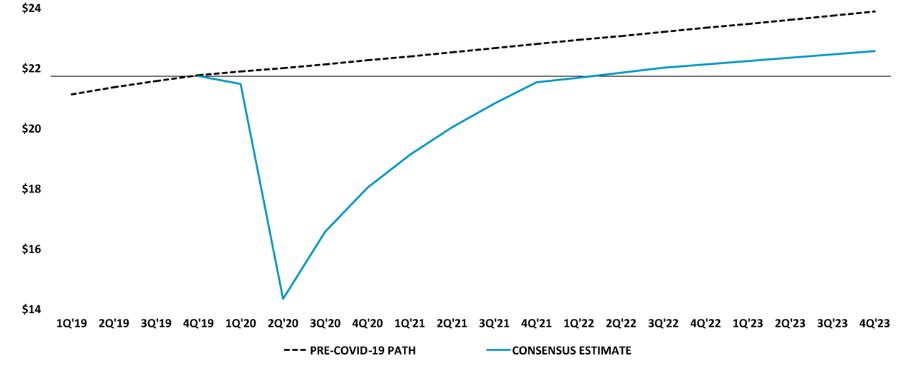
Consensus expectations have consistently been too optimistic, projecting that economic output would recover prior highs as early as 2021. As Figure 1 shows, the consensus expectation has now converged on the view that US GDP will not exceed pre-COVID levels until 2Q 2022.(2) It’s telling that the nonpartisan Congressional Budget Office (CBO), often more sanguine than consensus, recently released new estimates showing that US GDP would not recover its prior peak until 3Q 2022.(3) The risks to growth remain skewed to the downside in our view.
Figure 1: Consensus Estimates for US Real GDP Growth(2)
(US$ in trillions)
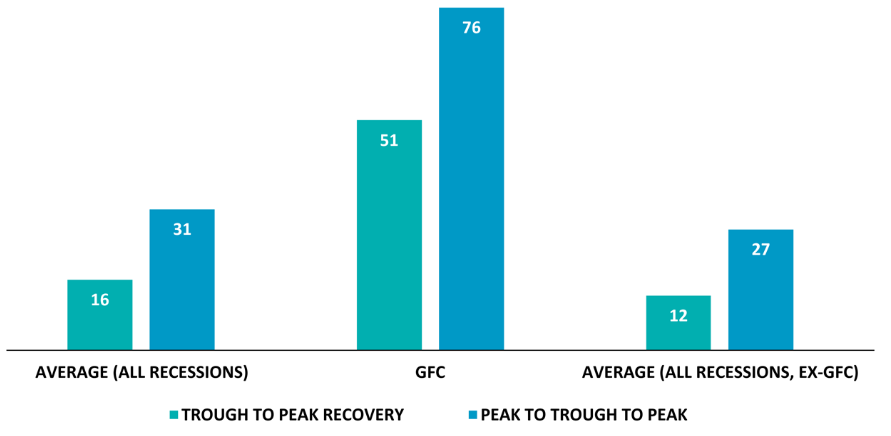
Joblessness and “the paradox of thrift” The tepid recovery will largely be a function of elevated joblessness, in our view. In a services-based economy, one person’s spending is another’s income. Coming out of recessions, consumers normally pay down debt and increase savings. With the consumer comprising around 70% of the US economy, an increase in savings has a negative effect on growth; it’s a concept known as “the paradox of thrift.” US household personal income peaked at $16.5 trillion in 2019. Based on 2019 levels, a 1% increase in savings would reduce GDP by approximately 80bps on an annualized basis, all else equal. The same analysis would result in a 75bps reduction in GDP growth in the Eurozone. Higher savings means a slower return to full employment. Over 87% of job losses were reported as temporary in April.(4) The downside risk is that a higher proportion of these layoffs become permanent due to consumer deleveraging. The result would be another so-called jobless recovery, such as the one following the Global Financial Crisis (GFC). Figure 2 shows that after the GFC, it took 76 months for the number of jobs to surpass the prior peak, compared to an average of 27 months for all other recessions since 1931.(5) Based on historical layoff and recall data, some researchers estimate 40% of job losses described as temporary today could become permanent.(6)
Figure 2: Number of Months for US Employment to Recover Prior Highs(5)
(based on all recessions from 1939 to 2019)
Fiscal policy generally expansionary Policymakers continue to discuss tools that can mitigate the economic headwinds from higher savings and weaker business spending and, importantly, stimulate long-term demand. The legislation passed thus far is not of the latter sort, in the sense that it wasn’t designed to spur increased economic output. It was a short-term backstop to try and arrest the economy’s freefall. Relief checks and unemployment benefits aren’t expansionary.
In the midst of the GFC in 2009, Congress and President Obama passed the $787 billion American Recovery and Reinvestment Act (ARRA). Critics at the time seized on some misleading claims regarding the bill’s fiscal measures. As one example, critics said each new job created cost $400,000 in stimulus spending, a number conveniently derived by dividing the total stimulus by the number of new jobs created. For another, several media members had fun with funding for curious projects, like the $1.25 million grant to create a fish orchestra (really).(7)
But a more careful analysis revealed encouraging results from the ARRA. Excluding education spending, the stimulus yielded a positive multiplier effect near 2x.(8) Well-guided stimulus spending isn’t necessarily bad economic policy, because the government’s cost of funding is below the economy’s potential growth rate.
Infrastructure a laggard Future bills with provisions for the long term would be a positive development. However, the positive effects of stimulus spending would require patience. Infrastructure plans garner headlines, and rightfully so. Few projects actually come ready for the shovel, given the taxpayer and environmental protections built into the government process for awarding and managing these types of projects. A study by the National Association of Environmental Professionals found that it takes 54 months on average for infrastructure projects to receive environmental approvals from federal agencies.(9) Notably, one year after the passage of the ARRA, just under 19% of the $48.1 billion earmarked for Department of Transportation projects had been disbursed.(10)
Investment Themes Accelerating
COVID-19 exposed deficiencies in the US economy, including how susceptible its business supply chains and healthcare are to a single point of failure. Just as the country’s reliance on foreign oil producers in the 1970s helped to spur the creation of domestic energy production, we expect the issues with a “just-in-time” global supply chain to catalyze changes and create significant investment opportunities. The virus also pushed growing secular trends such as e-commerce, remote working and domestic migration patterns into the limelight. We expect shifts in how people consume, how they work and, notably, where they choose to live. If so, housing is another area that could be positioned for long-term leadership.
From globalization to localization Supply chains were shifting even before the virus struck, as globalization appeared to peak in several arenas. China and the US negotiated their way to a truce, but trade wars emerged on other fronts: the US threatened Europe; Japan and South Korea raised barriers to trade; and global currency volatility increased. The unrest caused many companies to reassess their global operations, including the diminishing benefits from manufacturing overseas. In particular, the declining cost of labor advantage to manufacturing in China relative to other emerging markets is likely to accelerate the localization trend post-pandemic.
Tech as the supply chain A new supply chain powered by technology, including robotics and artificial intelligence, could make it cost-effective for US companies to bring production home. Technology-related capital expenditures in the US have been increasing relative to other forms of CapEx. Over the past five years, nonresidential fixed investment in intellectual property products has increased by a CAGR of 6.7%, while its share of total investment increased from 29.7% in 2014 to 34.1% in 2019. Compare this to spending on equipment and structures, with a five-year CAGR of 2.6% and 1.7%, respectively.(11) Cloud use and automation appear to be top priorities, as IT infrastructure spending is estimated to remain relatively resilient in 2020 (up +3.8% YoY), even as the economic downturn is projected to lead to a -5.1% YoY decline in overall IT spending.(12)
Healthcare’s new regimen A broad overhaul of healthcare infrastructure is likely. COVID-19 showed that the US needs to ensure adequate supplies, from basics like masks to complex drug compounds. Compelling investment opportunities could come from a concerted government effort to increase US development and manufacturing of all forms of medicine and related equipment. The addressable market in the US for medical devices alone is forecast to exceed $106 billion by 2023, while the US already imports over $132 billion per year in pharmaceutical products.(13)
Decoupling from China is a complex proposition, though. China is a critical component of the US medical supply chain, accounting for a majority of US imports of key pharmaceutical products and protective equipment. China and India collectively provide around 80% of active pharmaceutical ingredients to the US, and over 90% of generic drugs. China specifically has captured 97% of the US market for antibiotics, and a majority of the market in common painkillers such as ibuprofen.(14) And according to the Peterson Institute, China accounted for 48% of US imported protective equipment in 2018.(15) For certain critical subcategories, China supplies up to 70% annually.
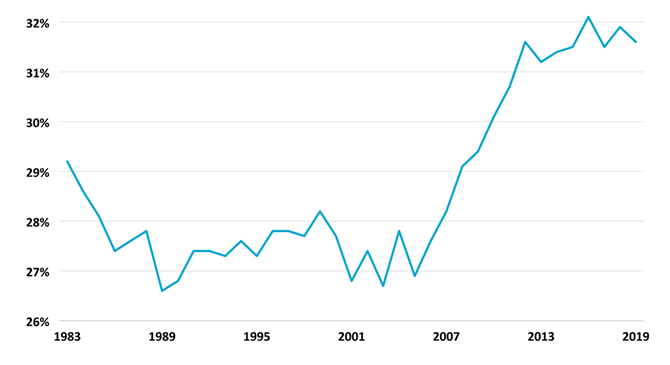
Housing’s turn again The housing market appears to have some of the strongest fundamentals in years, based on supply and demand dynamics. The housing industry once comprised 10% of US GDP, but its share of the economy fell in the aftermath of the GFC. Housing starts remained depressed in the post-GFC expansion. One reason is that younger cohorts delayed household formation. Figure 3 shows the record number of young people still living at home. We expect this undersupply and pent-up demand to converge and become an increasingly important economic force. At the same time, housing affordability is improving. Mortgage rates are lower and other forms of debt service remain manageable by historical standards.
Figure 3: US Young Adults Living at Home(16)
(share of total population aged 18-34)
Confidence is key as the economy adjusts to COVID change. And housing is illustrative. An industry like housing can’t take off until the pandemic is fully contained and people become comfortable with this “next new normal.” The rebuilding cycle will be long, joblessness will remain elevated and debt burdens will cast a shadow over financial flexibility. Companies will face inefficiencies as they shift supply chains, operate below full capacity and face new healthcare costs. The strong companies are likely to get stronger, while headwinds will increase for weak ones. But there will be a point when people start to look confidently into the future, whether via a vaccine or treatment, or simple resiliency. People will innovate and adapt, as they always have from crises. Dynamic sectors like housing, tech and healthcare represent over 30% of the US economy.(17) And there are reasons to believe that sectors like these can lead as the US starts to venture anew.
Stay safe, and please stay in touch.
The views expressed in this commentary are the personal views of Joe Zidle and do not necessarily reflect the views of The Blackstone Group Inc. (together with its affiliates, “Blackstone”). The views expressed reflect the current views of Joe Zidle as of the date hereof, and neither Joe Zidle nor Blackstone undertake any responsibility to advise you of any changes in the views expressed herein.
Blackstone and others associated with it may have positions in and effect transactions in securities of companies mentioned or indirectly referenced in this commentary and may also perform or seek to perform services for those companies. Investment concepts mentioned in this commentary may be unsuitable for investors depending on their specific investment objectives and financial position.
Tax considerations, margin requirements, commissions and other transaction costs may significantly affect the economic consequences of any transaction concepts referenced in this commentary and should be reviewed carefully with one’s investment and tax advisors. All information in this commentary is believed to be reliable as of the date on which this commentary was issued, and has been obtained from public sources believed to be reliable. No representation or warranty, either express or implied, is provided in relation to the accuracy or completeness of the information contained herein.
This commentary does not constitute an offer to sell any securities or the solicitation of an offer to purchase any securities. This commentary discusses broad market, industry or sector trends, or other general economic, market or political conditions and has not been provided in a fiduciary capacity under ERISA and should not be construed as research, investment advice, or any investment recommendation. Past performance is not necessarily indicative of future performance.
- Morgan Stanley Research estimates.
- Bloomberg, as of 5/21/20. Represents the average estimate of ten major banks.
- CBO, as of 4/24/20.
- Bureau of Labor Statistics, as of 5/11/20.
- Bureau of Labor Statistics. Represents all recessions from 1939 to 2019. Based on total nonfarm payrolls.
- National Bureau of Economic Research, Working Paper No. 27137, as of May 2020.
- “Stimulus for Cotton Candy, Tango and a Fish Orchestra? Wacky, or Actually Worthy?” ProPublica, as of 11/5/09.
- National Bureau of Economic Research, Working Paper No. 16759, as of February 2011.
- National Association of Environmental Professionals, as of November 2019.
- Department of Transportation, as of 2/23/10.
- Bureau of Economic Analysis and Haver Analytics, as of 12/31/19. Represents annual private nonresidential fixed investment.
- International Data Corporation, as of 5/4/20.
- FIME, Fitch Solutions and US International Trade Commission, as of 12/31/19.
- “The Coronavirus Outbreak Could Disrupt the U.S. Drug Supply” Council on Foreign Relations, as of 3/5/20.
- “COVID-19: China’s exports of medical supplies provide a ray of hope.” Peterson Institute for International Economics, as of 3/26/20.
- Census Bureau, Haver Analytics and Blackstone Investment Strategy, as of 12/31/19. Represents adult children of householders.
- Based on analysis of data from the Congressional Research Service, Centers for Medicare & Medicaid Services and National Telecommunications and Information Administration.
