Joe Zidle: “Don’t Fight the Fed” Takes On a New Meaning
Martin Zweig’s Winning on Wall Street, first published in 1970, is always on my short list of recommended reading for up-and-coming students of the markets. It was in this book that Zweig coined the famous phrase “don’t fight the Fed,” a concept that is one of the keys to keeping a portfolio on the right side of history.
For most of the last few decades, “don’t fight the Fed” meant risk-on mode. Investors were rewarded for keeping their foot on the gas pedal as central bank liquidity dampened volatility and drove outsized beta returns. As we have highlighted, those easy financial conditions were largely responsible for creating the longest and strongest bull market in history. But that’s all changed now, and investors must consider their positioning accordingly.
In this month’s essay We focus on how secular underinvestment in assets like housing, energy supplies and public infrastructure led to the shortages that are driving today’s higher inflation. The Fed’s strategy of increasing interest rates to curb inflation is slowing demand in interest rate–sensitive segments of the economy. However, because investment spending is also sensitive to rising rates, the fight against inflation is likely to lead to further underinvestment, exacerbating shortages and inflationary pressures even after the economy starts to recover. This won’t remove cyclical fluctuations in rates and inflation, but it is likely to establish a higher trend level for these fluctuations (higher highs, and higher lows) and lead to faster cycles.
From a portfolio perspective, we point out that duration management is particularly important in these conditions. We continue to favor short-duration hard assets because they can reset income levels.
Why the Market Wants to Fight
Inflation is at a 41-year high, and the Fed is in its most aggressive tightening cycle since 1994. Those two conditions differentiate this period from those leading up to the last few recessions. In this market, not fighting the Fed means accepting the idea of a longer hiking cycle and a higher terminal rate. But to date, the market isn’t ready to accept that.
The market can’t let the last cycle go The market is pricing in just about 75bps more in rate hikes, a peak in the Fed funds rate in 4Q 2022, and rate cuts starting a year from now. And yet, these expectations come as the Fed signals that it will tighten well into 2023, with the policy rate ending next year at least 50bps higher than what markets are pricing. Figure 1 highlights the diverging expectations for the Fed’s policy rate.
Figure 1: Expectations for Fed Funds Rate at End of Respective Years
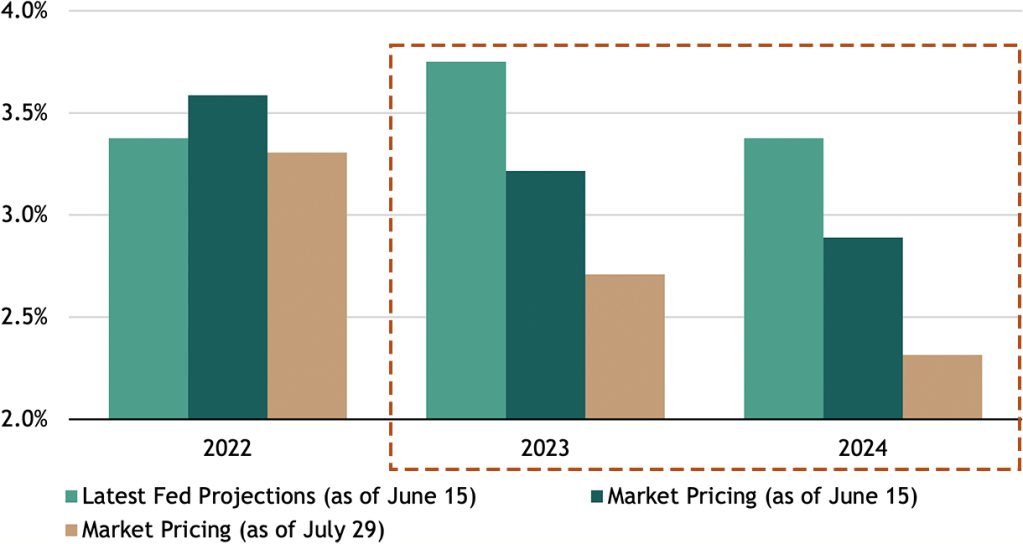
Source: Federal Reserve’s Summary of Economic Projections (SEP) and Bloomberg. Market data as of 7/29/2022. Latest SEP as of 6/15/2022. “Latest Fed Projections” represents the median of Fed officials’ expectations for the path of the Federal Funds rate. “Market Pricing” represents the implied path of the Federal Funds rate, based on Fed Funds futures, as calculated by Bloomberg.
The market seems to be pricing in something like the last cycle, using any plausible datapoint to believe in a quick return to easy money policies. The 1970s provide a useful, albeit imperfect, example of what is more likely to occur. That decade featured quicker bouts of inflation and shorter, more volatile economic cycles. Contrast that environment with the 2010s, when monetary stimulus dampened volatility and produced the longest expansion and bull market in history.
Today’s Underinvestment, Tomorrow’s Inflation
I think that today’s underinvestment will create tomorrow’s inflationary pressures, and that it will cause the world to look more like 1970 than 2010. Support for this view is that the US and many other advanced economies have not invested to increase capacity for decades.
Charting the years of underinvestment A prime example of this is how the lure of low-cost manufacturing from China was too tempting for the US to ignore. Meanwhile, investment in “real economy” and “old economy” categories captured an ever-smaller share of GDP. Figure 2 highlights the below-trend investment in the real economy as a share of output in the US.
Figure 2: US Gross Fixed Capital Formation
(% of GDP)
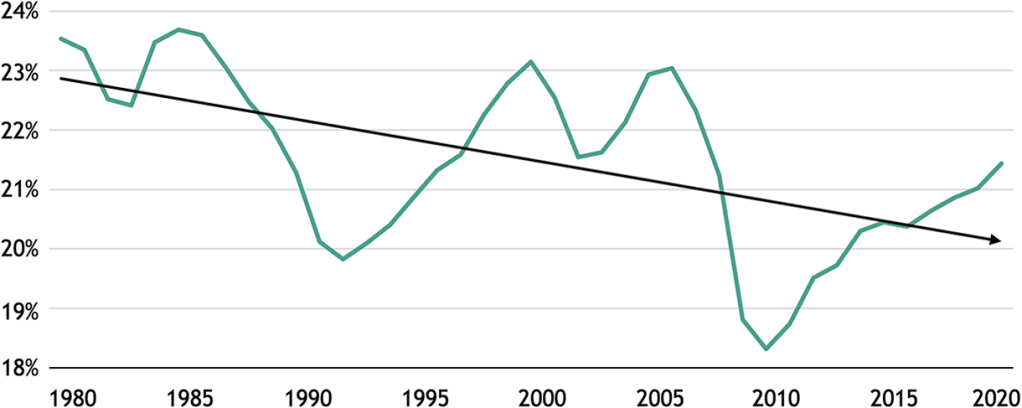
Source: World Bank, as of 12/31/2020. Arrow represents linear trendline.
Compounding this underinvestment, weak recoveries from crises left slack in many economies, including the US. Following the Tech Bubble and the Global Financial Crisis, the absence of strong economic growth and shifts in the underlying structure of the economy meant that capacity utilization trended lower, as Figure 3 shows.
Figure 3: US Capacity Utilization
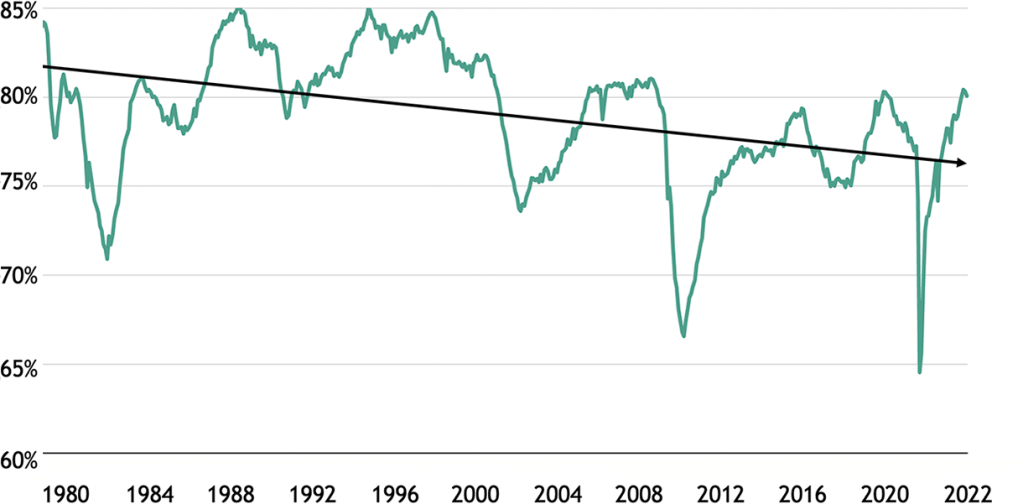
Source: Bureau of Economic Analysis and Bloomberg, as of 6/30/2022. Arrow represents linear trendline.
As a result of this slack, the average age of private fixed assets is the highest in nearly 70 years.1 Figure 4 shows how investors favored cash flow and share buybacks over capex and investment, seemingly punishing companies with high fixed investment.
Figure 4: Price Performance of Equity Indices
(indexed to 100 as of 1/3/2011)
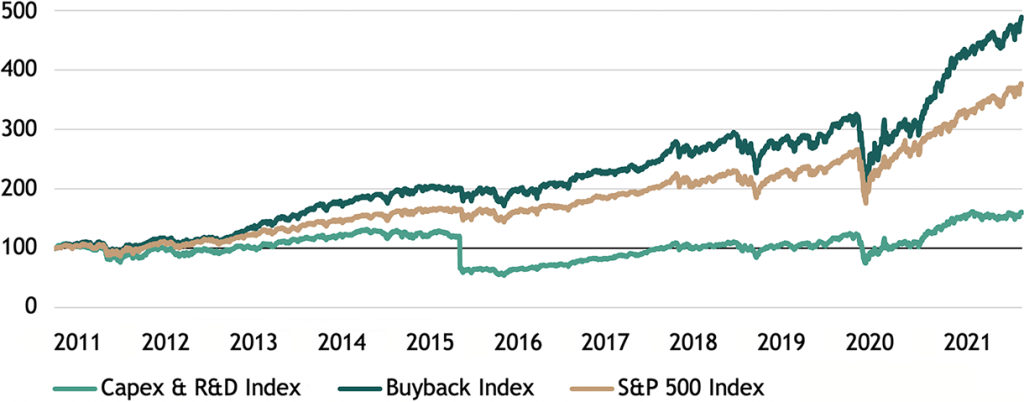
Source: Goldman Sachs, as of 12/31/2021. “Capex & R&D Index” calculated by GS, and represents stocks with the highest combined capex + R&D spending to market cap ratios. “Buyback Index” calculated by GS, and represents a basket of 50 S&P 500 stocks that have the highest trailing four-quarter buyback yield relative to their sector.
Pullback in investment at exactly the wrong time Today, the Fed and central banks globally are tightening policy to curb excess demand, but the current growth slowdown will likely also result in a decline in investment. Unfortunately, that’s exactly the opposite of what’s needed to address the shortages that are exacerbating inflation to begin with. This paradox means that housing, energy, commodities, infrastructure and even labor are likely to still be undersupplied once growth recovers, which is the argument for persistent inflation.
I believe the Fed will be successful in its aim of reducing demand in the short term, but its impact will vary across different segments of the economy. While certain services can be easily foregone, other types of demand don’t go away just because they are postponed. A home purchase delayed simply becomes pent-up demand. So, today’s shortages may rear their ugly heads again when demand recovers, which is why the Fed may be more apt to raise rates at the first whiff of an acceleration in price increases. And a trigger-happy Fed is definitely not one to fight, especially if it leads to shorter, more volatile cycles as in the 1970s, rather than the long cycles that began in the mid-80s.
Housing One of the Prime Examples of Underinvestment
The housing shortage in the US is estimated to be anywhere from 4 to 6 million units, equivalent to at least three years of new home completions.2 Coinciding with this shortage are demographic trends that will aggravate the problem. Figure 5 illustrates the rising demand that we expect from millennials entering prime homebuying age, and Figure 6 illustrates the shortfall in home completions. These long-term trends will linger and affect inflation, considering that shelter prices comprise nearly one-third of the CPI calculation.
Figure 5: Annual Change in Number of US Residents Aged 30-39(i)
(in thousands)
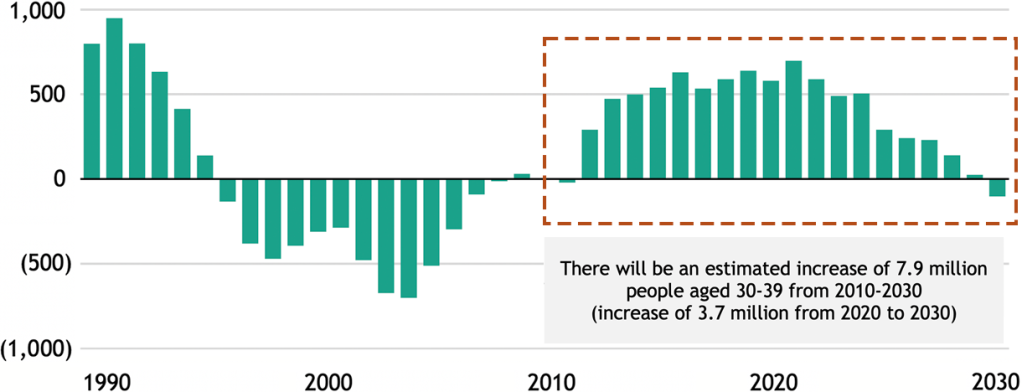
Source: Blackstone Investment Strategy calculations, Census Bureau projections and Haver Analytics.
(i)Actual data as of 2017; data for 2018 and beyond represent Census Bureau projections.
Figure 6: Home Completions Relative to Historical Average(i)
(thousands of units, rolling 10-year sum)
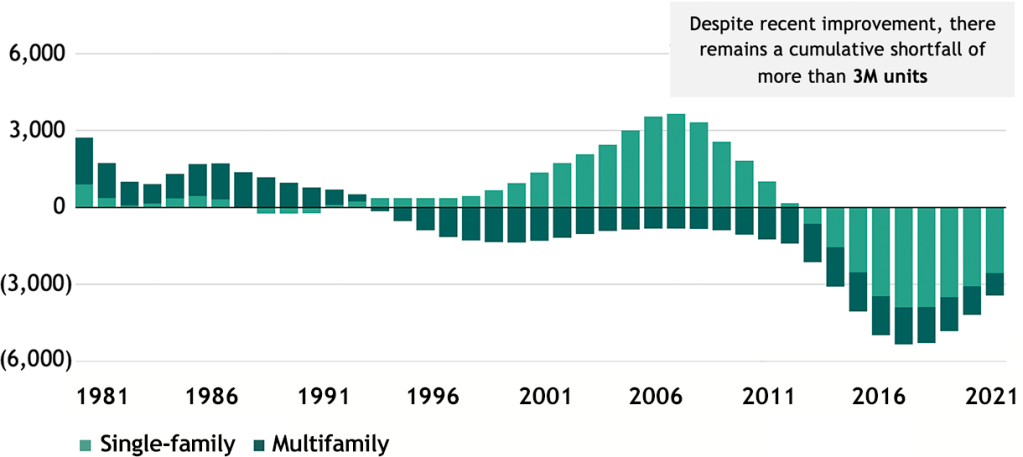
Source: Blackstone Investment Strategy calculations, US Census Bureau, US Department of Urban Housing and Development.
(i)As of 12/31/2021. “Home Completions” is the number of total new privately owned housing units completed in each calendar year, calculated as the average of monthly units completed at a seasonally adjusted annual rate. “Multifamily” housing units are defined as total less single-family. The “Historical Average” is the average of annual housing completions in each respective category from 1968 (earliest data available) to 2020.
Energy supply is another pain point Even before the war in Ukraine, oil markets suffered from exceptionally tight supplies following years of underinvestment. Rising energy prices typically spur investment in energy supply, but it’s been slow to ramp up since the recent surge in prices. Global investment in upstream oil and natural gas supply is expected to increase in 2022 but remain roughly 20% below 2019 levels.3 Investment in hydrocarbon supply is expected to remain nearly 30% below where it was when the Paris Agreement was signed in 2015.3 Further, investment in response to cyclical price swings typically focuses on short-term supply boosts rather than long-term capacity.
Falling demand won’t completely solve the issue. It would be natural to expect oil demand to contract as the global growth slowdown accelerates. Oil demand growth slows in most instances of US and global recessions; however, it seldom contracts. As the economy reeled in 2008, oil demand fell by just 1 million barrels per day (mbd).4 A risk is the potential for supply shortages to worsen if lenders further restrict access to capital in the downturn.
Supply-demand mismatch in renewable energy The global push towards decarbonization, including the adoption of electric vehicles and renewable energy, has created a demand for critical minerals. Lithium, nickel, and cobalt are needed for energy storage, while copper and aluminum are used for energy transmission. A recent report found that “the supply of such minerals will struggle to meet near-term demand” and that underinvestment in these materials will exacerbate shortages in the coming years.5 Until this mismatch is rectified, we expect prices for these commodities to remain elevated and contribute to medium-term inflation. The IEA found that costs for key clean energy technologies have already reversed years of falling prices and increased significantly in 2021. Figure 7 highlights a couple of these.
Figure 7: Technology Cost Trends for Solar PV Modules and Wind Turbines

Source: International Energy Agency, as of 6/21/2022.
Keeping a Portfolio on The Right Side of History
Fixing these investment shortfalls will take years, and higher price growth may make inflation even harder to predict in the meantime. Professor Aswath Damodaran of New York University argues that when inflation is in its highest quintile, the subsequent volatility of inflation over three years is higher than when it spends time in any other quintile. In his words, “When inflation is 10%, it’s far more likely to be swinging from 4 to 16 than (when) inflation is 2%.”6
Higher and more volatile price growth mean that the Fed may be more preemptive and forceful in acting to maintain price stability. This scenario is a recipe for structurally higher interest rates, with higher highs and potentially lower lows for the Fed Funds rate. Investors should recalibrate their return expectations accordingly.
Selectivity required Ongoing inflationary pressures and higher rates challenge profit margins, which highlights the importance of identifying operational efficiency. In these conditions, private credit market investors with proven track records of creating value and unlocking synergies through portfolio operations can be attractive. We don’t necessarily think that defaults need to rise meaningfully, but it will be incrementally more important to consider credit risk when rates are at 3% or higher than when they were at 1%. Private credit that is senior in the capital stack and secured can be one way to reduce credit risk.
What spurs inflation can spur innovation Returns tend to be best where capital is the scarcest, and in the event of a real downturn, certain sectors with critical needs might be starved for capital. For example, Russia’s invasion of Ukraine renewed focus on energy security, shoring up existing sources and accelerating the green energy transition. The EU’s recent energy bill was a welcome down payment on the latter. But more investment is needed. To avoid the worst impacts of climate change, scientists tell us we must transition our planet to net-zero emissions by 2050. The IEA estimates that $100 trillion of investment will be needed for this, with annual investments increasing five-fold from ~$750 billion invested in 2021 to $4.0 trillion a year by 2030.
COVID trends create opportunities The pandemic accelerated many pre-existing trends, from calling increased attention to supply chain resiliency, to further shrinking the workforce as many Baby Boomers opted for early retirement. These dynamics highlight potential opportunities in the reorientation of supply chains and related technologies and innovations that can make structurally smaller labor forces more productive.
Duration management across asset classes is critical Traditional fixed income is likely to continue to be challenged by elevated inflation and rates. Conversely, floating rate debt can adjust to rising rates. Other alternative sources of income can re-rate when inflation runs hotter, such as short-duration hard assets. In this category, we highlight real estate sectors with shorter average lease durations that are renegotiated more regularly and adjust for rising costs. Two examples are rental housing, which often has year-long leases, and hotel rooms, which can be repriced almost daily. These assets can respond to changing macro conditions more tactically than a commercial office lease with a duration of 5–10 years.
As usual, Byron will write the September essay, in which he will share insights from his annual Benchmark Lunch series. Until then, we wish you a wonderful rest of your summer.
With data and analysis by Taylor Becker.
- Bureau of Economic Analysis, as of December 31, 2020 (latest available as of August 2, 2022).
- Census Bureau, as of December 31, 2021. Based on 2021 levels of new privately-owned housing units completed.
- International Energy Agency, as of June 22, 2022.
- Bloomberg, as of May 17, 2022.
- PWC, as of June 22, 2022.
- Colossus, as of May 31, 2022.
The views expressed in this commentary are the personal views of Joe Zidle and do not necessarily reflect the views of Blackstone Inc. (together with its affiliates, “Blackstone”). The views expressed reflect the current views of Joe Zidle as of the date hereof, and neither Joe Zidle or Blackstone undertake any responsibility to advise you of any changes in the views expressed herein.
Blackstone and others associated with it may have positions in and effect transactions in securities of companies mentioned or indirectly referenced in this commentary and may also perform or seek to perform services for those companies. Blackstone and others associated with it may also offer strategies to third parties for compensation within those asset classes mentioned or described in this commentary. Investment concepts mentioned in this commentary may be unsuitable for investors depending on their specific investment objectives and financial position.
Tax considerations, margin requirements, commissions and other transaction costs may significantly affect the economic consequences of any transaction concepts referenced in this commentary and should be reviewed carefully with one’s investment and tax advisors. All information in this commentary is believed to be reliable as of the date on which this commentary was issued, and has been obtained from public sources believed to be reliable. No representation or warranty, either express or implied, is provided in relation to the accuracy or completeness of the information contained herein.
This commentary does not constitute an offer to sell any securities or the solicitation of an offer to purchase any securities. This commentary discusses broad market, industry or sector trends, or other general economic, market or political conditions and has not been provided in a fiduciary capacity under ERISA and should not be construed as research, investment advice, or any investment recommendation. Past performance is not necessarily indicative of future performance.
For more information about how Blackstone collects, uses, stores and processes your personal information, please see our Privacy Policy here: www.blackstone.com/privacy.