Joe Zidle: Considerations for the New Business Cycle
The annual Benchmark Lunch series is upon us. Byron hosts some of the world’s leading investors, business owners, academics and policymakers, and attending is always a highlight of my summer. Of course, the twist this year is that it’s an all-Zoom affair. But no matter the socially distanced format, the conversations about economic, sociopolitical and market-related issues are guaranteed to be thought-provoking. As always, we look forward to sharing some of our takeaways from the lunches in the September essay.
As this most unusual summer enters its final stretch, I wanted to share my thoughts on an element of the new COVID era that will become increasingly important: the outlook for the environment in which companies operate. In the last cycle, a handful of secular tailwinds combined to drive company performance to levels above the historical norm. In my view, these tailwinds are in the process of reversing. And as a result, I expect the average firm’s growth and performance to revert to the historical mean.
I remain optimistic on the future. But it’s important to acknowledge that the operating environment will become increasingly challenging and less forgiving. It will also separate strong companies from the rest of the pack. I expect investors to place higher premiums on growth and cash returns, two increasingly scarce commodities. They will be hard to come by in the gradual, square root–shaped recovery that Byron and I expect. Still, we see opportunities for discerning investors to capture outperformance. They just have to look a little harder.
Last Decade’s Outperformance: Four Tailwinds Blow
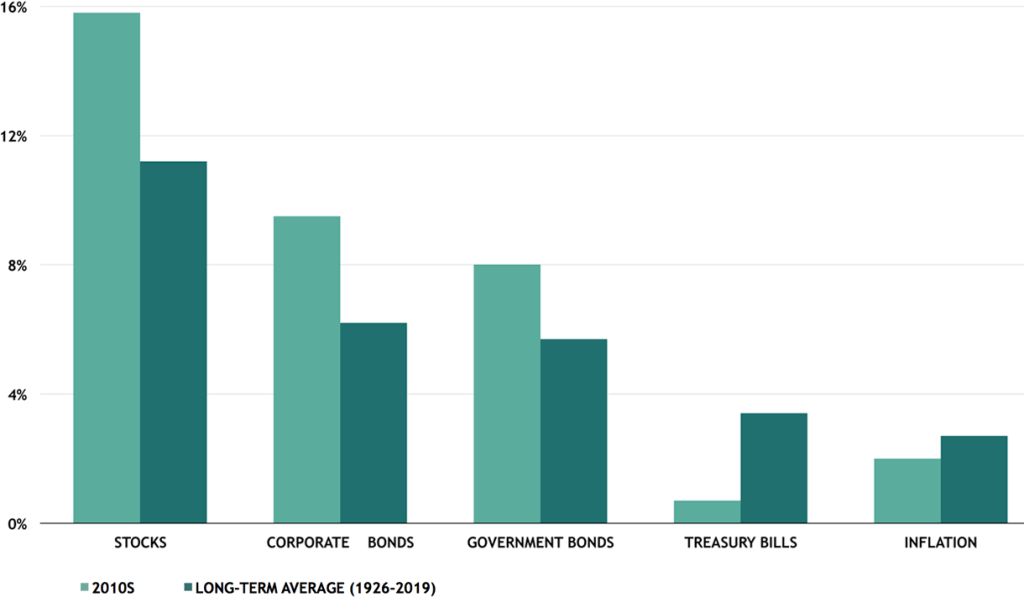
The expansion that followed the Great Recession was record-setting in several ways, not the least of which was its longevity. Record earnings growth and profit margins dotted the recovery through its climb, and through its various mini booms and busts along the way. Ultimately, the result was historically elevated returns across many major asset classes driven by four main secular tailwinds: low interest rates, lower corporate tax rates, falling operating costs and increased share buybacks.
Figure 1: US Asset Returns in 2010s vs. Historical Average1
(annualized)
Falling interest rates Lower and lower interest rates continually gave companies room to maneuver. When the Global Financial Crisis (GFC) ended in 2009, the 10-year Treasury yielded approximately 3.8%. And since then, spreads on 5-year investment grade debt fell from around 100bps to the pre-COVID level of 45bps. Quarter after quarter, companies refinanced at lower rates, boosting bottom-line results, at least in part through interest expense reduction. The S&P 500 interest expense margin (interest expense as a percent of sales) fell from around 5.5% in 2007 to just 2% at the end of 2017. Meanwhile, the amount of nonfinancial debt outstanding essentially doubled from $3.5 trillion at the end of the GFC to about $7 trillion recently, but the amount of interest that corporations paid as a percent of total US GDP declined from 2% in 2009 to 1.6% in 1Q’20.2
Shrinking corporate taxes The effective corporate tax rate was already in secular decline prior to the passage of the Tax Cut and Jobs Act of 2017. But in the year following its passage, US corporate taxes as a percent of GDP fell to the lowest levels in the 55 years of data on file.3 And as companies shifted their revenue abroad, they often found more favorable tax conditions for that income. Globally, the average corporate tax rate declined from 40% in 1980 to 24% in 2018. Just under one-fifth of countries had a tax rate above 30% in 2018, down from nearly one-third of countries in 2010.4
Cost-effective globalization The benefits of globalization paid consistent dividends for companies in the post-GFC expansion. Companies embraced outsourcing to the lowest-cost
producer. At the start of the last cycle, hourly compensation costs in the largest export-oriented Asian countries were 10%–20% the US. It’s no surprise, then, that US imports from Asia nearly doubled in the last cycle, from $0.6 trillion in 2009 to $1.1 trillion in 2018, and the US trade deficit with the region widened.5
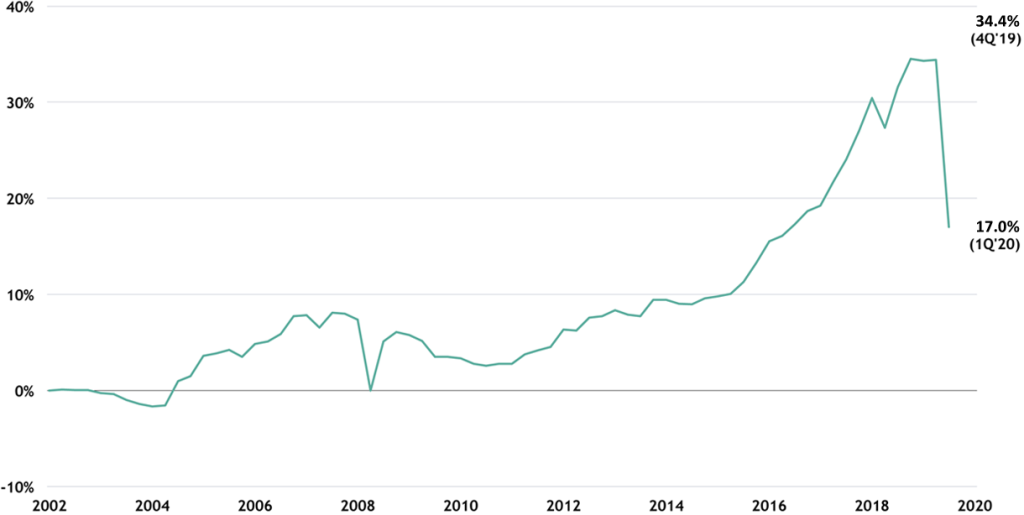
Fewer shares outstanding As we highlighted in our 3Q webinar, share buybacks were a major driver of performance in the last cycle. From 2009 to 2019, the corporate sector purchased $4.5 trillion of US equities (net), while all other sectors accounted for under $200 billion in net purchases.6 Naturally, earnings per share increased with profits divided among fewer and fewer shares outstanding. Figure 2 highlights the impact of share buybacks on S&P 500 earnings growth. Reducing the denominator of EPS every year provides a good head start to earnings growth.
Figure 2: Cumulative S&P 500 EPS Growth in Excess of Net Income Growth7
The New Business Cycle: Operational Flexibility Shrinks
Before COVID-19 really flared, Byron and I cut our estimates of long-term profits growth in half to just 5% a year, consisting of 2% economic growth, 2% inflation and perhaps 1% from productivity. Now with that potent mix of tailwinds reversing and adjustments to the lingering COVID crisis necessary, many companies face new challenges with limited room to maneuver.
Companies boxed in A defining feature of this new cycle will be the general decline in operating flexibility. Across sectors and regions, rising costs associated with deglobalization trends will challenge profit margins. Nearshoring and onshoring are likely to increase supply chain security and create investment opportunities but result in lower efficiency. The costs of fighting COVID-19 will lead to ever-higher debt. We expect interest rates to remain low for years, but bond yields are already at record lows. The cost of capital for companies is unlikely to go much lower, if at all, given that spreads already tightened back to their pre-COVID-19 levels. And corporate taxes are unlikely to move meaningfully lower. These two factors in particular will challenge operating income and curb those growth-boosting share repurchases.
Supply chains exposed The iPhone travels over 500,000 miles in the manufacturing process—a distance greater than if it traveled to the moon and back. It’s a prime example of investor demand for supply chain efficiency and customer demand for products virtually right away (and in the exact color they want). But COVID-19 exposed the risk of a single point of failure in a global supply chain—one breakdown brought commerce to its knees. That COVID-induced breakdown got the attention of CEOs; in Blackstone’s 2Q CEO survey, a sizable number of CEOs indicated that they’re considering plans to nearshore or onshore supply chains.8 Global trade volumes had already been declining before the onset of the pandemic. So, with the supply chain pendulum swinging from efficiency to security, we see implications for the costs of goods and services sold.
Workplace renovations needed The Centers for Disease Control and Prevention (CDC) has guidance on how companies can implement health and safety protocols. And the Occupational Safety and Hazard Administration (OSHA) offers preliminary guidance on air quality, ventilation and barriers to promote social distancing, in addition to general work policy recommendations. But companies will have to spend more to bring effective, long-lasting changes to their workplaces. An important consideration moving forward will be whether these will be run-rate cost increases, or one-time expenses that will fade as the virus is brought under control. Liability waivers may provide some protection, but the ability to use such waivers as a means to eliminate liability risk is not unlimited as a matter of public policy or otherwise.
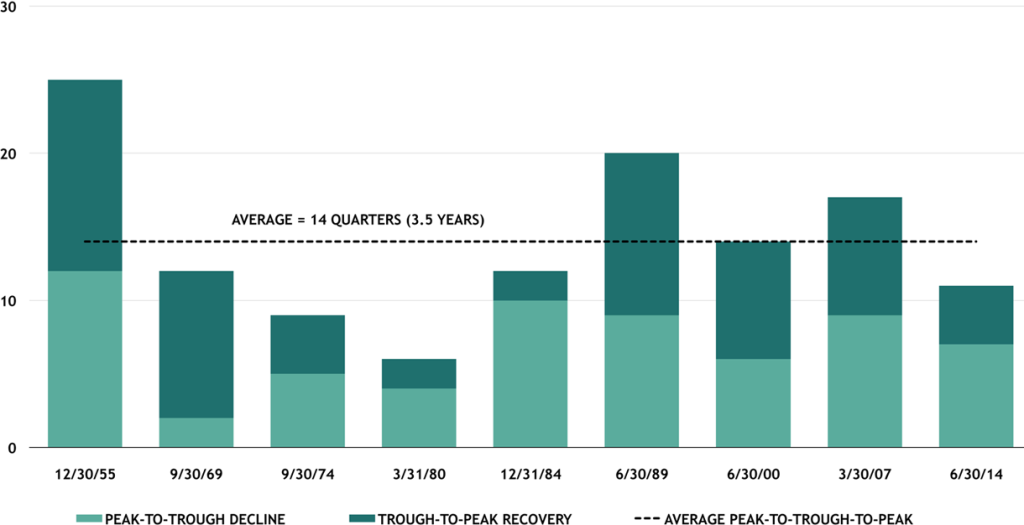
The result: An out-of-consensus view What we lay out above goes against the grain. With the S&P 500 trading at 22x forward earnings, the market doesn’t seem to be pricing in these changed conditions. Bottom-up analysts aren’t acknowledging the changing winds either—they expect S&P 500 revenue and earnings to reach new record highs by the end of next year.8 By historical standards that view appears optimistic. Figure 3 highlights that on average it takes 3.5 years for profits to return to prior cyclical peaks.
Figure 3: Peak-to-Trough-to-Peak Analysis of S&P 500 Earnings Recessions9
(in quarters)
Opportunities to Consider: High-Conviction and Thematic Investing
There is good news, though. Challenges create opportunities. And we remain optimistic that investors will have significant opportunities to deploy capital as new market leadership emerges. It’s all about growth for companies in the new cycle, namely top-line revenue and sustainable cash flow growth. In our view, those companies that can either outgrow the competition or innovate ways to increase their operational flexibility will present the most interesting opportunities. To gain exposure to that growth, we see this environment as primed for asset selection through high-conviction and thematic approaches.
Real alpha generation’s comeback Many active managers found outperformance difficult to achieve in the post-financial crisis expansion, with market dynamics largely favoring one and all. Beta reigned supreme as equity indices around the world reached record-low return dispersions. There has been a shift however, and investors are likely to need more than a large balance sheet to generate returns. The next cycle could herald the return of real alpha generation, especially given the potential that a growing number of companies here in the US may linger as zombies.
The most recent data show that 20% of all US firms have debt servicing costs higher than their profits.10 We expect this trend to continue as lower rates keep many companies with broken business models on artificial life support.
Filters for the noise In the next cycle, outperformance will be the prize awarded to discerning investors who implement filters in their investment process. We expect two filters to be particularly important: avoiding value traps and partnering with great management teams. In regard to value traps, technology has enabled a winner-takes-all economy that allows headwinds to damage weak companies faster than in previous cycles. It will be crucial to avoid the misconception that buying companies in challenged sectors on the cheap will translate into good value in the long run. In this complex, fast-changing environment, strong management will be another key source of alpha in navigating lower operational flexibility.
COVID themes take hold Blackstone’s 2Q CEO survey highlighted some of the themes that could lead in the COVID-19 aftermath, including the shift to e-commerce and increased inventory levels in the logistics sector.8 Technology will continue to provide innovations across sectors, with live entertainment a breeding ground for new, socially distanced, digital and virtual experiences. We also see some traditional sectors like US housing benefitting in the years ahead, as a result of good fundamentals and demographic trends.
**
We hope you enjoy the rest of your summer, and we look forward to sharing our thoughts from the Benchmark Lunches with you next month.
- Source: BofA Global Research, Ibbotson, Datastream and Bloomberg, as of 12/31/19.
- Source: Federal Reserve, as of 3/31/20.
- Source: OECD, as of 12/31/17.
- Source: Tax Foundation.
- Source: Bureau of Labor Statistics and Census Bureau.
- Source: Federal Reserve and Haver Analytics, as of 12/31/19. Includes purchases of all US corporate equities, including shares of exchange-traded funds, closed-end funds and real estate investment trusts. “All other sectors” includes all domestic sectors (ex-US nonfinancial corporate business) and foreign sectors.
- Source: S&P and Strategas Research Partners. Most recent data are for 3/31/20, as of 7/31/20.
- Source: Blackstone, as of 6/30/20. Represents responses from a subset of CEOs from Blackstone’s corporate private equity, real estate and credit businesses.
- Source: Bloomberg and Blackstone Investment Strategy. Based on quarterly trailing twelve-month S&P 500 earnings per share. “Earnings recession” is defined as two consecutive quarters of negative year-over-year EPS growth. Peak in earnings is defined as the high in absolute EPS levels attained prior to an earnings recession, while trough in earnings is defined as the low in absolute EPS levels attained subsequent to the onset of an earnings recession.
- Source: Datastream, Worldscope and DB Global Research, as of 6/30/20. Represents share of listed firms that are more than ten years old with an interest coverage ratio less than one for three years in a row.
The views expressed in this commentary are the personal views of Joe Zidle and do not necessarily reflect the views of The Blackstone Group Inc. (together with its affiliates, “Blackstone”). The views expressed reflect the current views of Joe Zidle as of the date hereof, and neither Joe Zidle nor Blackstone undertake any responsibility to advise you of any changes in the views expressed herein.
Blackstone and others associated with it may have positions in and effect transactions in securities of companies mentioned or indirectly referenced in this commentary and may also perform or seek to perform services for those companies. Investment concepts mentioned in this commentary may be unsuitable for investors depending on their specific investment objectives and financial position.
Tax considerations, margin requirements, commissions and other transaction costs may significantly affect the economic consequences of any transaction concepts referenced in this commentary and should be reviewed carefully with one’s investment and tax advisors. All information in this commentary is believed to be reliable as of the date on which this commentary was issued, and has been obtained from public sources believed to be reliable. No representation or warranty, either express or implied, is provided in relation to the accuracy or completeness of the information contained herein.
This commentary does not constitute an offer to sell any securities or the solicitation of an offer to purchase any securities. This commentary discusses broad market, industry or sector trends, or other general economic, market or political conditions and has not been provided in a fiduciary capacity under ERISA and should not be construed as research, investment advice, or any investment recommendation. Past performance is not necessarily indicative of future performance.


