Joe Zidle: Looking Beyond the Volatility
The coronavirus continues to take its toll. The scope is simultaneously unimaginable and yet all too real. By some estimates, the virus has resulted in 760 million people being put under quarantine at some point, an undertaking never seen before in human history.1 We hesitate to endorse any estimates of the economic damage right now. The dispersion of forecasts is as wide as they are uncertain. But we continue to believe that the economic effects will be transitory. History is clear on that point.
We expect the economic trends going into this global health emergency to dictate the trends coming out of it. Mini, rolling recessions throughout the global economy seem likely in the interim, especially for the countries most levered to foreign trade. In fact, they seem inevitable when we consider that China—representing over 28% of global manufacturing production—is effectively shut-in.2 Singapore, Japan and Germany, already faced with falling export volumes as a result of confrontational trade policies, are candidates for technical recessions. Corporations are beginning to respond to virus fears by restraining investment and hiring plans, as well. This compounds economic risks, and will likely impact revenues and profits over the next few quarters.
For now, central bank liquidity injected since the crisis unfolded in Wuhan put a floor on the global economy and simultaneously raised the ceiling on asset prices. The biggest central banks are currently injecting over $100 billion per month into the markets and are forecasted to continue to do so over the short term.3 In the process policymakers, charged with monetary policy, have created an unusual scenario where good news is good, bad news is better and the worst news is the best (see Figure 1). In just 35 business days so far this year, the S&P 500® had 18 new closing highs.
The potent combination of unwavering liquidity and record-low rates makes predicting what forces could break this positive feedback loop tough. But we remember Stein’s Law, a paraphrase of which is: “Trends that can’t continue, won’t.” Perhaps one of the most visible trends of the past decade has been the inexorable outperformance of beta-oriented investing. Don’t take that for granted, because the conditions that made it possible—increasing debt, ever-falling rates and multiple expansion—are changing. This next decade may require thematic and high-conviction investing to offset structurally lower returns.
Figure 1: All News Has Been Good News for Markets4
S&P 500 Price Level (July 2019 to current)
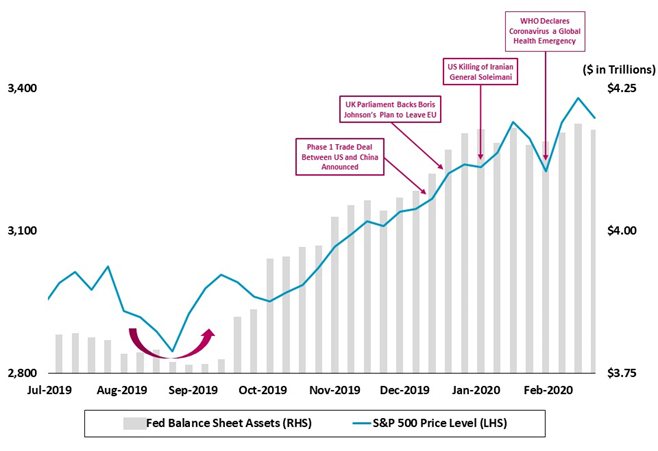
Record High Debt + Record Low Rates + Higher Multiples = The Roaring 2010’s
Higher high debt… A $70 trillion increase of global debt over the last decade helped to shatter records for stock market performance, buybacks, interest rates, credit spreads and others. But rewriting the history books came at a cost: $255 trillion of global debt, to be precise.5 Critically, one record still stands. We are 127 months into this expansion, but it’s failed to produce even average GDP growth. In fact, this is the weakest expansion since World War II.
+ Record low rates… Along with record high debt, investors benefited from record low interest rates. Globally, short-term interest rates are again are sitting on a 5,000-year low.6 US real rates, represented by the 2-year Treasury yield minus the inflation rate (CPI), have gone even more deeply negative, and have in turn pushed savers into riskier assets. The Fed will likely have to cut rates in response to the coronavirus, meaning that rates could go lower during this crisis before they eventually bottom.
+ Higher multiples… Opportunities in the non-financial economy remained limited over the last decade, as evidenced by slack in US factories. The capacity utilization rate has barely moved back to its 50-year average. That lack of demand has depressed private and business investment data across major countries. Instead, with few opportunities to deploy capital in the real economy, investors concentrated their bets in fewer and fewer sectors and asset classes. Record amounts of capital have flowed into bonds during this recovery, and the pace of flows over the past twelve months has only sped up. The S&P 500 a decade ago traded at 11 times earnings, but recently was priced at nearly 20 times the next 12 months earnings.
= Record outperformance This combination of record debt issuance, record low rates and expanding multiples caused the S&P 500® to return an above average 13.5% per annum since 2010, without so much as one 20% correction along the way.7 The outperformance has accelerated with central bank help; the so-called “disruptor stocks” are up nearly 50% since September, when the Fed started increasing its balance sheet holdings.
The Risks: Less Productive Debt, a Trough in Rates and Lower Multiples
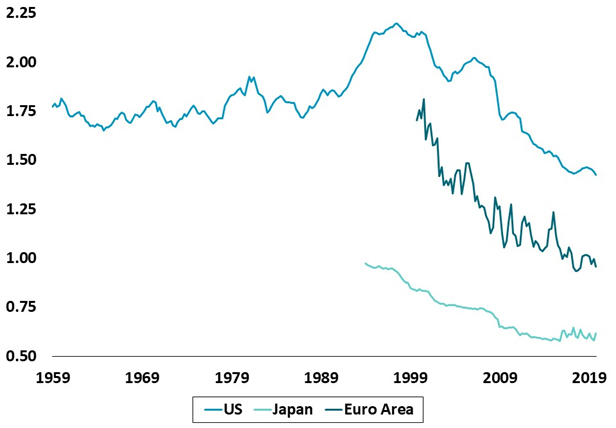
Diminishing returns of debt The falling velocity of money illustrates how record debt may fail to produce the same amount of growth seen in previous periods. In the US, the turnover of money supply (M2) is the lowest in history. Japan and Eurozone clock in at even lower levels (see Figure 2), suggesting that the US may have further to fall.
Absent a productivity boost, the data invite an important question: How much more debt will it take to produce acceptable levels of growth? In 2019, the US only saw about $0.35 of growth for every $1 increase in debt. Comparable figures are worse for the EU and Japan. It took 186 years for the US to accumulate its first trillion dollars of debt, but just one year to accumulate its most recent trillion. The marginal impact of each additional dollar of debt is clearly diminishing.
Figure 2: M2 Velocity at All-Time Lows Globally9
Velocity of M2 Money Stock (US, Japan and Euro area)
A trough in rates We expect higher rates on the long end of the curve to emerge as a key secular theme after the global economy shifts into healing mode. As we write, the 10-year Treasury yield is down to 1.35%, pretty much following the playbook of other global health emergencies. As during the SAARS and Ebola outbreaks in the past, US Treasuries are a safe harbor. They rally going into a crisis and, as the health emergency passes, Treasury prices fall and rates back up. We believe longer-dated bond yields will eventually move higher due to a combination of emerging inflationary pressures. This includes steady price increases in housing and medical care services, as well as the supply-demand mismatch in Treasury markets that we highlighted in our Ten Surprises of 2020.
Lower multiples ahead If we are right that the economic effects of the coronavirus will turn out to be transitory, then one could expect a back-up in real yields to exert pressure on multiples. As all investors should be aware, as bond yields generally increase, the fair value of equities generally decreases. Our Dividend Discount Model shows that even a 50-basis-point rise in the 10-year Treasury yield, assuming a relatively conservative 5% earnings increase next year, would show the S&P 500 to be nearly 10% overvalued, based on recent price levels.
Thematic and High Conviction Investing
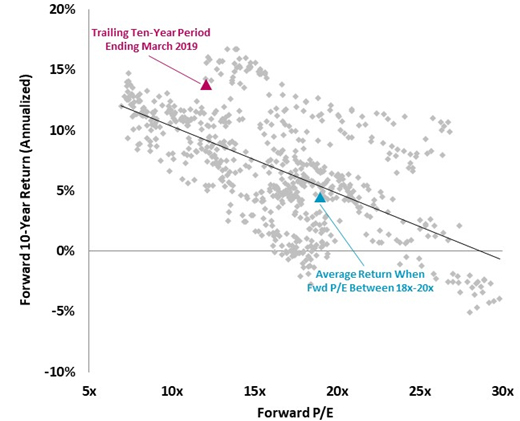
Our view is that the conditions that created a decade’s worth of high returns and low volatility—which favored beta and passive strategies in nearly all asset classes—will be difficult to repeat. Debt runs the risk of being less productive, and interest rates won’t fall forever. This will pressure the cyclical highs in multiples currently seen across public and private investments. Deploying capital in public equities at today’s valuations of nearly 20x earnings has historically produced below-average returns (Figure 3). Structurally lower returns will require an increased emphasis on thematic and higher conviction investment decisions. Beta exposures—or simply “owning the market”—may prove significantly less rewarding, as formerly favorable tailwinds dissipate.
Figure 3: Higher Multiples Imply Lower Forward Return10
S&P 500 Forward Returns at Varying P/E Levels (1964 to 2019)
An opportunity to reevaluate and reposition When the world transitions from crisis to healing mode, we expect investor focus will return to allocating capital, a particularly tricky endeavor in this slower-growth environment. Central bank liquidity has seemed to reign supreme, but higher valuations, higher debt, slower growth and already lower rates are reasons to think that the market’s positive feedback loop won’t “go on forever.”
Another Stein Law, probably said best with a sly wink and nod, is that economists are not all that great at predicting when trends will stop.11 Even so, it never hurts to listen, consider and prepare. And preparation amid the real prospect of structurally lower returns means scrutinizing assets and strategies from new angles.
The views expressed in this commentary are the personal views of Byron Wien and Joe Zidle and do not necessarily reflect the views of The Blackstone Group Inc. (together with its affiliates, “Blackstone”). The views expressed reflect the current views of Byron Wien and Joe Zidle as of the date hereof, and none of Byron Wein, Joe Zidle or Blackstone undertake any responsibility to advise you of any changes in the views expressed herein.
Blackstone and others associated with it may have positions in and effect transactions in securities of companies mentioned or indirectly referenced in this commentary and may also perform or seek to perform services for those companies. Investment concepts mentioned in this commentary may be unsuitable for investors depending on their specific investment objectives and financial position.
Tax considerations, margin requirements, commissions and other transaction costs may significantly affect the economic consequences of any transaction concepts referenced in this commentary and should be reviewed carefully with one’s investment and tax advisors. All information in this commentary is believed to be reliable as of the date on which this commentary was issued, and has been obtained from public sources believed to be reliable. No representation or warranty, either express or implied, is provided in relation to the accuracy or completeness of the information contained herein.
This commentary does not constitute an offer to sell any securities or the solicitation of an offer to purchase any securities. This commentary discusses broad market, industry or sector trends, or other general economic, market or political conditions and has not been provided in a fiduciary capacity under ERISA and should not be construed as research, investment advice, or any investment recommendation. Past performance is not necessarily indicative of future performance.
Endnotes:
1. New York Times, Sunday Feb 15th https://www.nytimes.com/2020/02/15/business/china-coronavirus-lockdown.html
2. United Nations Statistics Division, as of 12/31/18. Based on the value added by manufacturing in constant 2015 US dollars.
3. Strategas Research Partners, as of 2/24/20. Based on balance sheets for the Federal Reserve, Bank of Japan, Bank of England and European Central Bank.
4. Bloomberg, The Federal Reserve and Blackstone Investment Strategy, as of 2/21/20.
5. Institute of International Finance, as of 3/31/19.
6. Harlane, “Stuck” (speech at Open University, 6/30/15). Interest rate data according to a Bank of England study.
7. Bloomberg and Blackstone Investment Strategy, as of 2/21/20.
8. Bloomberg, as of 2/21/20. Based on the NYSE FANG+ Index, an equal-dollar weighted index designed to represent a segment of the technology and consumer discretionary sectors, consisting of highly traded growth stocks of technology and tech-enabled companies such as Facebook, Apple, Amazon, Netflix and Google.
9. Federal Reserve, Bank of Japan, European Central Bank and Blackstone Investment Strategy, as of 12/31/19.
10. Blackstone Investment Strategy calculations, Bloomberg and Standard & Poor’s. Represents monthly price levels and trailing 12‐month price‐to‐earnings ratios for the period 1/1/1964 through 12/31/2019.
11. Note: If you follow Herb Stein’s work closely enough you will see where his son, the immensely talented Ben Stein, gets his humor from.