Joe Zidle: “Transitory” Inflation Is Proving Costly
The Oxford English Dictionary selected “vax” as its 2021 Word of the Year.1 For the Federal Reserve, “transitory” might be a more fitting selection. Over the past 12 months, price pressures emerged as economies reopened and supply struggled to meet robust demand fueled by historic stimulus. Along the way, central banks insisted that inflation could be attributed to “transitory factors” and would fade as things got back to normal in COVID-exposed sectors.
But that argument is more difficult to maintain with each new record-shattering Consumer Price Index (CPI) print (see Table 1). After the Fed’s November communications, policymakers and investors alike might be reaching for their dictionaries to find a word that better describes the current environment. As Chair Jerome Powell himself admitted, “Transitory is a word that people have had different understandings of.”2
Table 1: US CPI Inflation Components
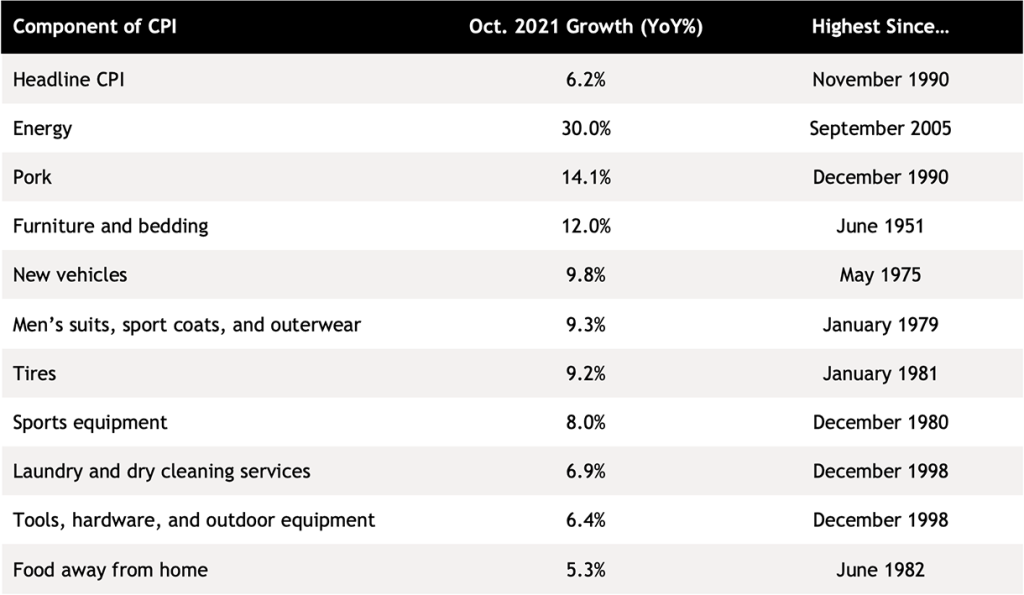
Source: Blackstone Investment Strategy and Bureau of Labor Statistics, as of 10/31/2021. Reflects components of the Consumer Price Index (CPI) for All Urban Consumers.
Inflation: At the used car dealership, and beyond In the first few months of 2021, price pressures were largely isolated to a few sectors particularly exposed to the idiosyncrasies of the COVID economy. For example, prices for used vehicles soared as the global semiconductor shortage stunted new car manufacturing and rental car companies attempted to rebuild inventories. Now, inflation is everywhere: More than 80% of CPI components are currently running at or above 2.5% annual growth (see Figure 1).
Figure 1: Share of CPI Components with Inflation Above 2.5% YoY
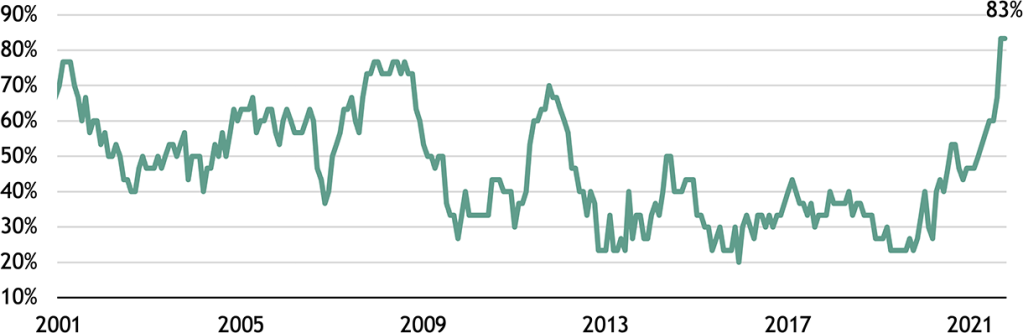
Source: Blackstone Investment Strategy and Bureau of Labor Statistics, as of 10/31/2021. Based on a decomposition of the Consumer Price Index (CPI) for All Urban Consumers into 30 component parts.
Real yields hit the mat Investors are taking note of this inflationary environment. The yield on 30-year inflation-linked Treasury securities nose-dived over the past eight months, hitting an intraday record-low -0.62% on November 10th after a weak bond auction. Several factors are responsible for this dip, including the illiquidity of the market for TIPS (Treasury Inflation-Protected Securities) compared to that for nominal Treasuries. But massive inflows into inflation-protected exchange-traded funds signal that investors are concerned about structurally higher inflation – and are willing to pay a steep premium to protect against it (see Figure 2).
Figure 2: Net Inflows to iShares TIPS Bond ETF
(US$ in billions, cumulative since 3/1/2020)
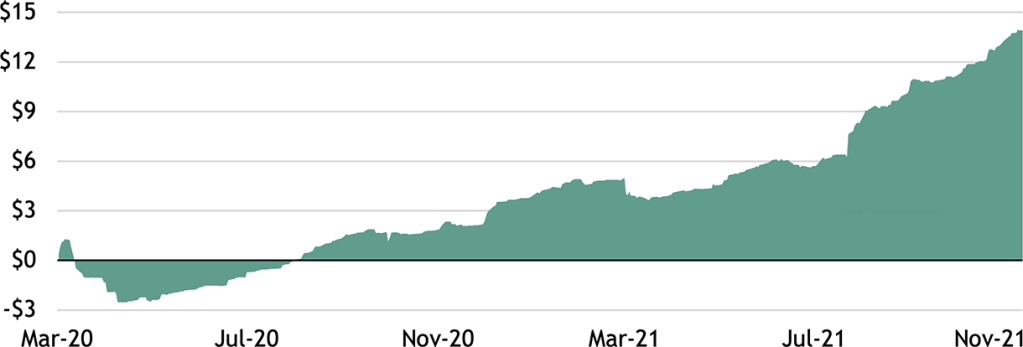
Source: Blackstone Investment Strategy and Bloomberg, as of 11/12/2021. The iShares TIPS Bond ETF tracks the Bloomberg Capital US Treasury Inflation Notes Index. “Net Inflows” is the daily change in shares outstanding times the fund’s net asset value.
Protection at any price? I would caution against overpaying for inflation protection in credit markets. Net flows into high yield fixed income funds spiked again last week, and junk bond issuance set an annual record on November 9th as borrowers capitalize on historically low yields.3 Even though the shorter average duration of high yield bonds offers an advantage against duration risk compared to investment grade assets, valuations are still steep. Bloomberg’s high yield index has a deeply negative real yield, and its spread to the 10-year Treasury yield is in the 4th historical percentile.4
In my view, there are more attractive ways to position for persistent inflation. Investors should consider floating rate assets, which can benefit from higher growth and rates, and senior secured debt, which is more protected against credit risk. Also, real estate remains an excellent hedge against inflation since income streams can reset more regularly than coupons from traditional bonds. And, real estate returns remain attractive: major sectors’ average cap rate is currently 5.1%, representing a spread of about 350-bps to the 10-year, much wider than the historical average.5
With data and analysis by Taylor Becker.
- Oxford Languages, as of 10/31/2021.
- Federal Reserve, as of 11/3/2021.
- Bloomberg, as of 11/9/2021.
- Bloomberg and Bureau of Labor Statistics, as of 10/31/2021. Based on the Bloomberg US Corporate High Yield Bond Index’s yield to worst (YTW). “Real yield” is defined as the index’s YTW less US CPI for All Urban Consumers (YoY%). Historical percentiles are calculated using monthly observations from January 1987 through October 2021.
- Green State Advisors, as of 11/1/2021. “Major sectors” include apartment, industrial, mall, office, and strip center. The historical spread between the average cap rate of these “major sectors” and the 10-year Treasury yield has averaged about 275-bps since January 1986.
The views expressed in this commentary are the personal views of Joe Zidle and do not necessarily reflect the views of Blackstone Inc. (together with its affiliates, “Blackstone”). The views expressed reflect the current views of Joe Zidle as of the date hereof, and neither Joe Zidle or Blackstone undertake any responsibility to advise you of any changes in the views expressed herein.
Blackstone and others associated with it may have positions in and effect transactions in securities of companies mentioned or indirectly referenced in this commentary and may also perform or seek to perform services for those companies. Blackstone and others associated with it may also offer strategies to third parties for compensation within those asset classes mentioned or described in this commentary. Investment concepts mentioned in this commentary may be unsuitable for investors depending on their specific investment objectives and financial position.
Tax considerations, margin requirements, commissions and other transaction costs may significantly affect the economic consequences of any transaction concepts referenced in this commentary and should be reviewed carefully with one’s investment and tax advisors. All information in this commentary is believed to be reliable as of the date on which this commentary was issued, and has been obtained from public sources believed to be reliable. No representation or warranty, either express or implied, is provided in relation to the accuracy or completeness of the information contained herein.
This commentary does not constitute an offer to sell any securities or the solicitation of an offer to purchase any securities. This commentary discusses broad market, industry or sector trends, or other general economic, market or political conditions and has not been provided in a fiduciary capacity under ERISA and should not be construed as research, investment advice, or any investment recommendation. Past performance is not necessarily indicative of future performance.