Joe Zidle: Navigating Growth and Technology Post-COVID
In any other year, two major upcoming geopolitical events would be more than enough for the market to contend with. We’re less than two months away from what will be a contentious, and possibly contested, presidential election in the US. Also approaching is the deadline for what remains a highly uncertain resolution to Brexit. But these events, plus COVID-19-induced extremes in the economy, the markets, volatility and sentiment, put 2020 in a class by itself.
In assessing public health risk, the most basic job of any virus is to replicate itself, and COVID-19 is exceptionally good at its job. Additional infectious waves this fall and winter are a risk. Nonetheless, I am optimistic that with so many drugs in development, a breakthrough vaccine will come sooner rather than later. Fortunately, medical professionals have come a long way since the first wave in treating patients affected by the virus. For those reasons, I’m also optimistic that we can avoid future widespread lockdowns.
COVID-19, however, continues to cause long-term damage to the global economy. And full recovery will take years. As a result, central banks will continue to pump ever-more monetary stimulus into the economy, but with lower and lower marginal benefit. For investors, slow growth, scarcity of income and frothy financial markets will make for a challenging environment.
Investors rightly turned to technology as an area of high growth in the COVID era, but the sector has seen extremes of its own recently—both in sentiment and valuation. So, this month, with tech questions aplenty, I tapped one of our experts, Blackstone Senior Managing Director Jas Khaira, to share his thoughts on some of the key technology trends he’s watching. But before we get to Jas, some background on the macro environment that I expect and some context for tech’s recent growth track.
Welcome to the Disconnected Bull Market
We should prepare for an investment environment challenged by slower economic growth, record debt loads, lower productivity and less financial flexibility. The direction of fiscal policy is uncertain, depending on the outcome of November’s election, but the Federal Reserve and other global central banks will likely counter headwinds with record levels of monetary policy support. This liquidity-driven bull market will, in my opinion, further separate itself from the more challenged fundamentals. However, across advanced economies, fiscal stimulus isn’t as effective in stimulating growth as it once was. In the 1980s, each dollar of federal debt in the US corresponded with approximately $1.42 of economic growth.1 In the past decade, the productivity of federal debt was less than half that amount, with a dollar of federal debt corresponding with just 70 cents of GDP growth. Figure 1 shows the cumulative change in both over the two periods.
Figure 1: Cumulative Change in Federal Debt Levels and US GDP
(1980s vs. 2010s, US$ in billions)
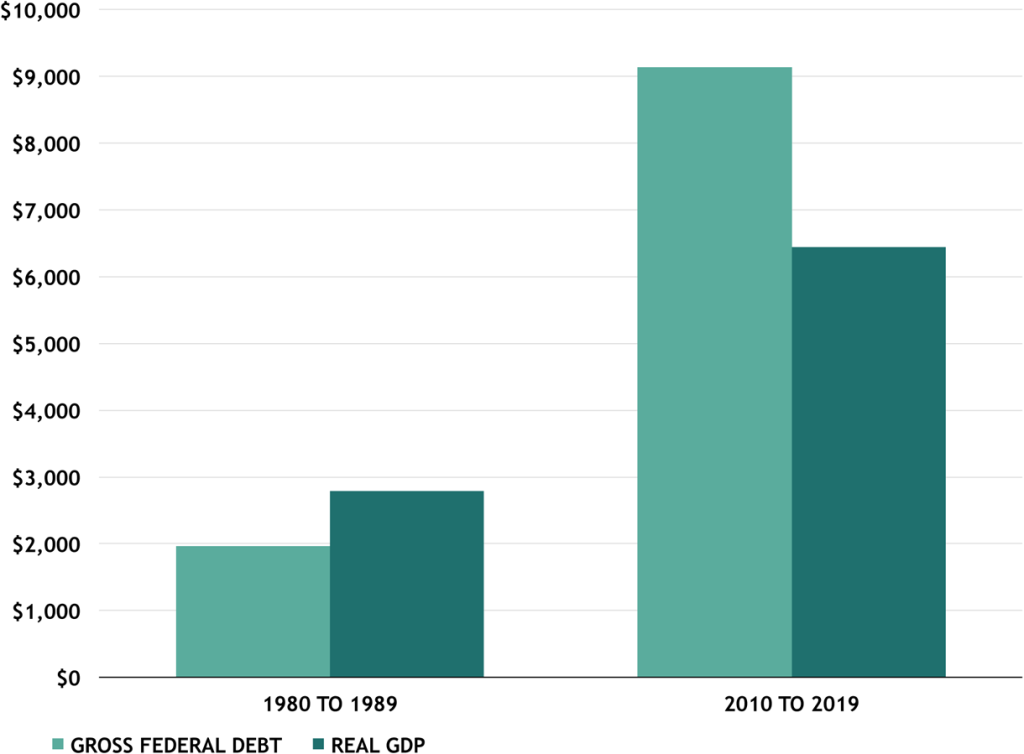
Source: Bureau of Economic Advisers, Office of Management and Budget and Haver Analytics, as of 12/31/19. Gross federal debt based on fiscal year.
This phenomenon is not limited to the US, and it appears that aging demographics may have a role to play. A recent study by the International Monetary Fund (IMF) found that population aging alters the effect of government spending on economic output levels. In non-aging economies, increases in government spending of around 1% of GDP were associated with increases in economic output of around 0.6%.2 For aging economies, a similar proportion of government spending did not result in a statistically significant output boost. With more debt being created less productively, one unintended consequence of further policy stimulus might be ever-greater asset price inflation.
Growth along the S-Curve
Finding new opportunities in this disconnected market will be critically important. The tech sector is well regarded for its growth, but investors must be mindful of the concentration risk at the top. Leadership in the S&P 500® is even narrower today than at the peak of the tech bubble in 1999/2000. The top five market weights in the S&P 500 comprised 18% of the index at the end of 1Q’2000, compared to a record-high 24% today.3
Facebook, Apple, Amazon, Netflix, Google and Microsoft (FAANGM) benefit from faster revenue and profits growth and a combined profit margin 50% greater than the S&P 500. But this year excess liquidity, and perhaps a lack of opportunities in other sectors, pushed valuations of these stocks to a record 40x next 12 months’ earnings.4 The probability of these companies monetizing future innovations is high. Growth, though, often follows a varied path. Investors shouldn’t get carried away by exponential growth. Rather, they should recognize the importance of the S-curve.
Exponential growth is temporary. Rapid increases are followed by inevitable slowdowns, whether it be in corporate profits, investment returns or technological innovations. The most common variety of growth follows an S-shaped pattern: from a very low rate of growth to a peak and back to a low rate as the growth process matures.5 Investing along the growth curve when it transitions from low to exponential growth offers the possibility of open-ended earnings potential compared to investing at the other stages of the growth curve where rates reflect cyclical or logistic growth.
That being understood, technology will continue to innovate, disrupt the status quo and present opportunities for investors. Jas recently hosted a meeting on emerging trends in technology investing that got me thinking about how to think about tech’s next chapter.
The Next Generation of Tech
by Jas Khaira, Senior Managing Director, Blackstone
Joe’s method of understanding growth by conceptualizing cycles as S-shaped is helpful to frame where we are today with technology companies in the Information Age. For example, Figure 2 shows how US petroleum consumption began to grow exponentially for the majority of the 20th century, otherwise known as the Age of Oil and Automobiles, before slowing down sharply.
Figure 2: Energy Consumption in the US
(1900-2009, quadrillion British thermal units)
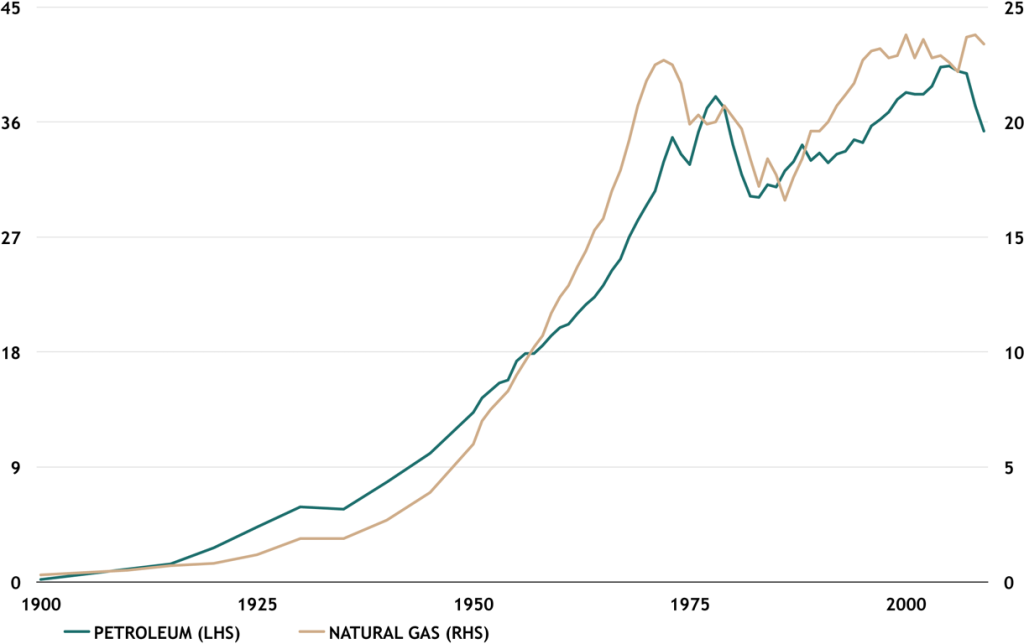
Source: EIA, based on the years 1900 to 2009.
Compare Figure 3 with Figure 2. Cisco’s analysis shows that global internet traffic, with the concomitant creation of digital data, is growing exponentially, with no signs of slowing down over the next decade.
Figure 3: Global Internet Traffic Volumes
(1984–2020, billions of gigabytes/month)
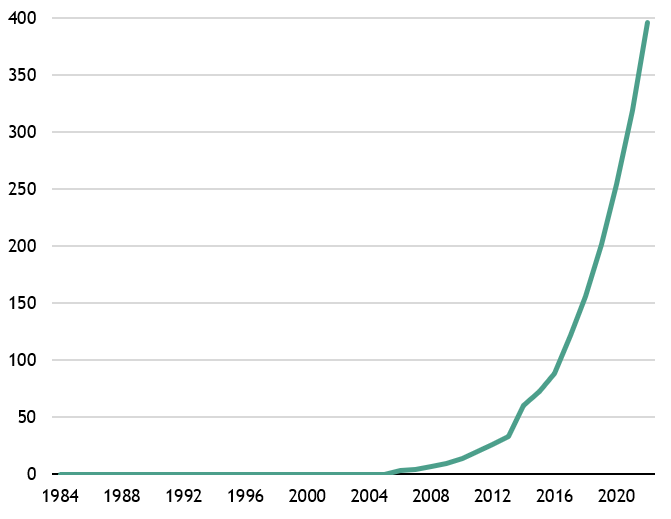
Source: Cisco, as of 3/9/20.
In recent years, our team has zeroed in on opportunities that leverage this growth while identifying emerging trends that will shape the next generation of technology companies. In what follows, I share four of the key trends that drive our thinking.
The cloud is underhyped Many analysts highlight the potential of AI and 5G, but we believe that the public cloud as a computing evolution is actually underestimated and that it will continue to create significant economic value over the long term. One reason is that the cloud deploys computing power as a utility service. Many of the largest technology companies today are service-based platform companies that would not exist without the cloud, including the likes of Netflix, PayPal and Salesforce.
The connection of mobile devices to the cloud has enabled a new consumer ecosystem today where we purchase our goods (Amazon), communicate with each other (Facebook), develop relationships (Bumble), move around (Uber) and travel (AirBnB). In the next decade, the cloud will enable new platform companies that go beyond our mobile devices. These companies will connect to different devices embedded in the industrial economy. Their platforms will manage our automobiles, our warehouses and factories, and our healthcare systems to reduce costs and improve outcomes.
Amazon, Microsoft and Google are the three global hyperscalers who are building competing cloud architectures. Figure 4 shows their cumulative capital expenditures. These firms illustrate Joe’s S-curve view as they generate exponential growth in anticipation of the massive opportunity in the public cloud space. Not to be outdone, China has its own flavor of hyperscaler in Alibaba, Tencent and Baidu, companies that are no less ambitious in their growth and spending. That leads certain estimates to peg worldwide public cloud service revenues at more than $1.1 trillion between 2019 and 2022.6
Figure 4: Cumulative Capital Expenditures
(2001–2Q’2020, US$ in billions)
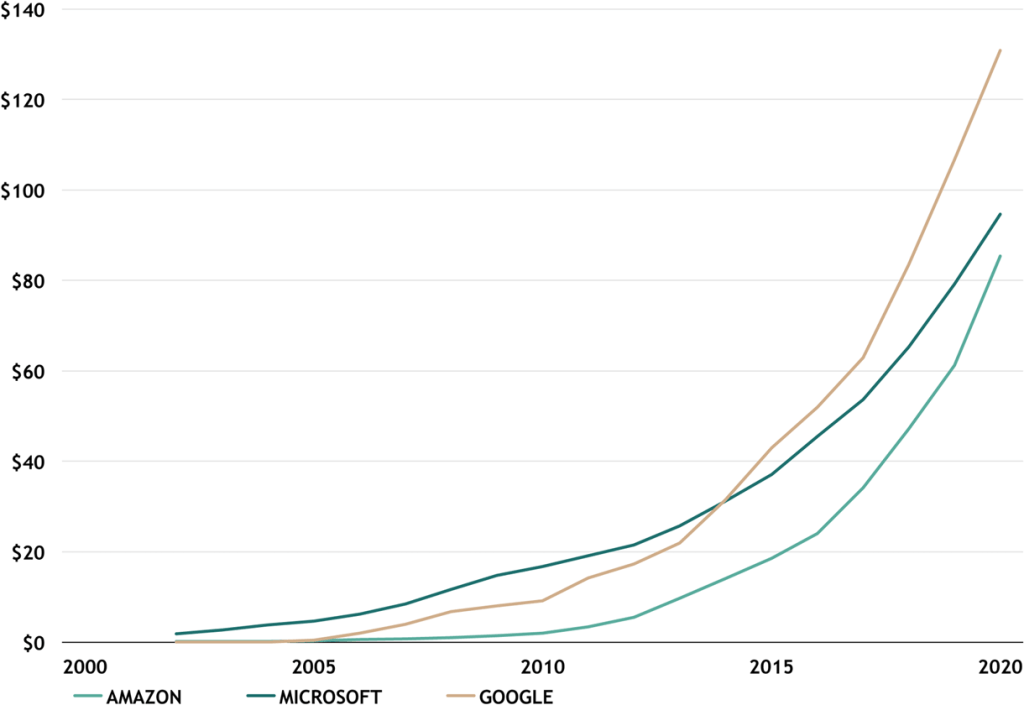
Source: Bloomberg, as of 6/30/20
Data centers: Where the cloud lives The growth of hyperscalers would make you think that a gravitational force is pulling capital and new businesses into their orbit. The most foundational structure of the cloud is the data center, and today there are over 5,000 enterprise or hyperscale data centers in the world to support the public and private cloud. For perspective, the total square footage in enterprise data centers exceeds the square footage in skyscrapers globally, and it’s growing at a much faster rate.7
The amount of capital required to build a data center built-to-suit for the hyperscalers is 50% higher than a comparable industrial warehouse per square foot. However, rental rates are 200% higher per square foot.8 While the US is the epicenter of information infrastructure today, the next decade will feature new availability zones and core nodes in emerging hyperscale markets like Spain, Italy, Poland, Japan, Indonesia and India.
One of the biggest challenges for the industry is power consumption. In 2017, global data center energy consumption was 40% more than all the energy consumed by the United Kingdom.9 So power efficiency, cooling and renewable sources of energy loom large in the next phase of data center development.
Living on the edge: The Internet of Things Much is made in the media about what 5G means for driverless cars and virtual reality. But our conversations with the largest mobile companies lead us to believe that the first scale applications will involve smart manufacturing, warehouse automation and remote applications in the mining and energy industries.
Above all else, the collision of these systems with humans and real things demands real-time data. 5G will make mobile devices, whether smartphone or smart sensor, the “edge” of the network; that is, the point at which people and things connect to the digital world. But to connect these devices to aggregation points and the mobile core, 5G requires significant investment in this Infrastructure Edge. The Infrastructure Edge is the solution to the speed of light as an immutable constraint. As a result, it will present opportunities to invest in high-density fiber, small-cell tower sites and private LTE networks.
An even bigger opportunity lies within the world’s large industrial companies, such as Emerson Electric, which has an installed base of over $100 billion.10 Using the Infrastructure Edge will allow firms like these to transform themselves from equipment companies to data companies. The process is complex, but the rationale is straightforward: Why sell a new sensor when you can use sensors to collect data and sell software and recurring services back to customers that will increase their profitability?
Fiber to the home Many are familiar with Moore’s Law, wherein Gordon Moore, co-founder of Intel, perceived that the number of transistors on a microchip would double every two years. It’s one of the best-known and consistent exponential growth functions in recent history. Less well-known is the exponential growth of internet speeds and network access over the past three and a half decades, as Figure 5 shows.
Figure 5: Internet Connectivity Speed
(1984-2019)
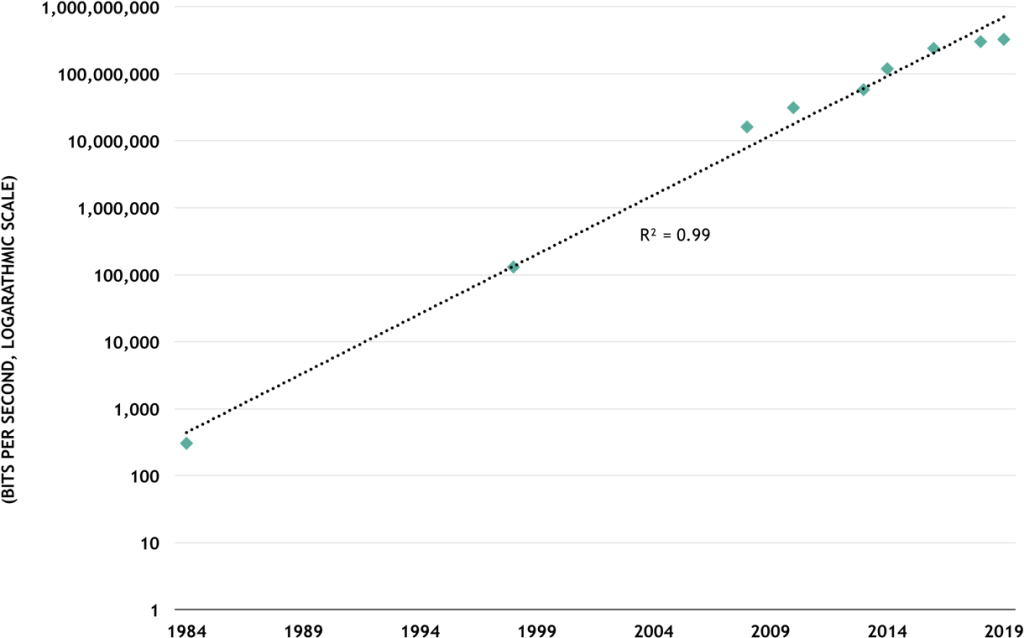
Source: Nielsen Norman Group, as of 9/27/19.
COVID-19 accelerated the shift towards high-speed broadband usage at home. It accelerated the shift so much that we reached an inflection point in 2020, where broadband internet revenues at America’s largest cable companies exceeded video revenues. Further, the profitability of broadband is significantly higher due to the rise of content and programming costs in prior years.
Consumer demand for higher speeds, driven in part by gaming and the now-ubiquitous Zoom, has launched a land grab. Companies want to upgrade internet connectivity speeds to their theoretical limit using fiber-optic technology instead of copper. Rural telecom incumbents and cable companies are spending CapEx to re-architect their last-mile networks with fiber, and in certain markets new competitors are disrupting existing players with fiber-only broadband systems. While these businesses resemble cable companies, they have higher contribution margins given the lack of programming and content costs, as consumers pay only for broadband service.
Joe Zidle: Final Thoughts on Growth Challenges and Opportunities
Jas’ thoughts are timely, given that many investors are seeking safety in size and concentrating their holdings in just a handful of tech giants. But even as high-flying as tech has been, and despite its massive growth potential, it’s not without risk. The exponential growth that created the phenomenon of FAANG+ is already well recognized. Also, in a more challenging economic environment, policymakers must keep interest rates at record lows and balance sheets supportive of elusive growth and inflation targets. The result is that higher valuations and tighter credit spreads don’t reflect the fundamental challenges facing companies in a low-growth, high-debt environment.
But among other revelations this year, the pandemic has shown that it’s a thematic accelerant for resourceful sectors like tech. Certain themes, some of which pre-dated COVID, are likely to persist in the US, such as onshoring of supply chains, domestic outmigration from northern and central states, and continued growth in e-commerce penetration. These and newer themes, including those related to advancing vaccines, will increasingly frame what a post-COVID world might look like. Over time, I expect that they’ll reveal those companies with the potential to harness growth earlier in their life cycle and produce the next wave of excess returns.
With data and analysis by Taylor Becker.
1. Bureau of Economic Advisers, Office of Management and Budget and Haver Analytics, as of 12/31/19. Gross federal debt based on fiscal year.
2. IMF Working Paper No. 20/92, as of 6/12/20.
3. Ned Davis Research, as of 8/31/20.
4. I/B/E/S data by Refinitiv, as of 9/18/20. “FAANGM” stocks include: Facebook, Amazon, Apple, Netflix, Google (Alphabet) and Microsoft. Note: Both classes of Alphabet are included.
5. Smil, Vaclav. Growth: from microorganisms to megacities. Cambridge, Massachusetts: The MIT Press, 2019.
6. Gartner, Inc., as of 7/23/20.
7. Mills, Mark P. Digital cathedrals. New York, New York: Encounter Books, 2019.
8. Internal Blackstone analysis.
9. Forbes, as of 12/15/2017.
10. Emerson Electric, as of 2/13/20.
The views expressed in this commentary are the personal views of Joe Zidle and Jas Khaira and do not necessarily reflect the views of The Blackstone Group Inc. (together with its affiliates, “Blackstone”). The views expressed reflect the current views of Joe Zidle and Jas Khaira as of the date hereof, and none of Joe Zidle, Jas Khaira nor Blackstone undertake any responsibility to advise you of any changes in the views expressed herein.
Blackstone and others associated with it may have positions in and effect transactions in securities of companies mentioned or indirectly referenced in this commentary and may also perform or seek to perform services for those companies. Investment concepts mentioned in this commentary may be unsuitable for investors depending on their specific investment objectives and financial position.
Tax considerations, margin requirements, commissions and other transaction costs may significantly affect the economic consequences of any transaction concepts referenced in this commentary and should be reviewed carefully with one’s investment and tax advisors. All information in this commentary is believed to be reliable as of the date on which this commentary was issued, and has been obtained from public sources believed to be reliable. No representation or warranty, either express or implied, is provided in relation to the accuracy or completeness of the information contained herein.
This commentary does not constitute an offer to sell any securities or the solicitation of an offer to purchase any securities. This commentary discusses broad market, industry or sector trends, or other general economic, market or political conditions and has not been provided in a fiduciary capacity under ERISA and should not be construed as research, investment advice, or any investment recommendation. Past performance is not necessarily indicative of future performance.


