Joe Zidle: Asset Allocation’s New Challenge
There seems to be a growing disconnect between what the Fed says it will do and what market participants think it will do. With a solid recovery underway, investors are pricing in rate hikes as soon as 2022, despite efforts by Fed Chair Jerome Powell and Fed officials to convince market participants otherwise. The Fed announced its new mandate at this year’s virtual Jackson Hole conference, but the market is signaling that the central bank needs to back up its talk. It won’t be the first time the Fed needed to build credibility on a new policy stance. In 1979, newly named Fed Chair Paul Volcker dramatically altered the Fed’s mandate to beat double-digit inflation rates.
Reining in inflation wasn’t necessarily a new policy goal for the Fed back then. As New York Fed president and vice chair of the Federal Open Market Committee, Alfred Hayes spent years targeting money supply growth to tame inflation and manage the economy. But when Volcker became Fed chair in August 1979, he targeted interest rates rather than money supply, arguing that the new approach would give him enough control over the economy to “slay” inflation.1 Markets didn’t believe he would be willing to risk a recession to achieve his goal. The prevailing view was that he would cave to political pressure at the first signs of economic weakness. Subsequently, inflation expectations remained high. By 1981, however, Volcker had doubled interest rates. The policies generated a recession, but they did beat inflation.
The difference today is that the Fed’s goal is to spur moderate inflation on a sustainable basis. The Fed will likely enlist the support of fiscal policymakers, especially if the election results in a Blue Wave. In recent testimony before Congress, Powell argued that “the recovery will be stronger and move faster if monetary policy and fiscal policy continue to work side by side to provide support to the economy.” The International Monetary Fund and other organizations are urging much the same.
Byron and I expect coordinated policy action to continue. But even with so much excess liquidity out there, we believe the US economy will struggle to produce the inflation that policymakers seek. We look for lower rates for longer than consensus or even the Fed foresees, the unintended consequences of which will challenge traditional asset allocation, in our view.
Cyclical Inflation Rebound vs. Secular Disinflation
Cyclical pressures Shorter-term increases in inflation as the recovery advances are likely. Inflation expectations recently rebounded off their prior lows. In addition, import prices are driving producer prices higher. Even Japan and the Eurozone experienced short-term inflationary peaks in their long deflationary valleys. But in our opinion, the demographic headwind plaguing the US will tamp down any temporary lift in prices. To understand this phenomenon, we need to look no further than the aging populations in Japan and Europe. Their past is our present; their prologue is our future.
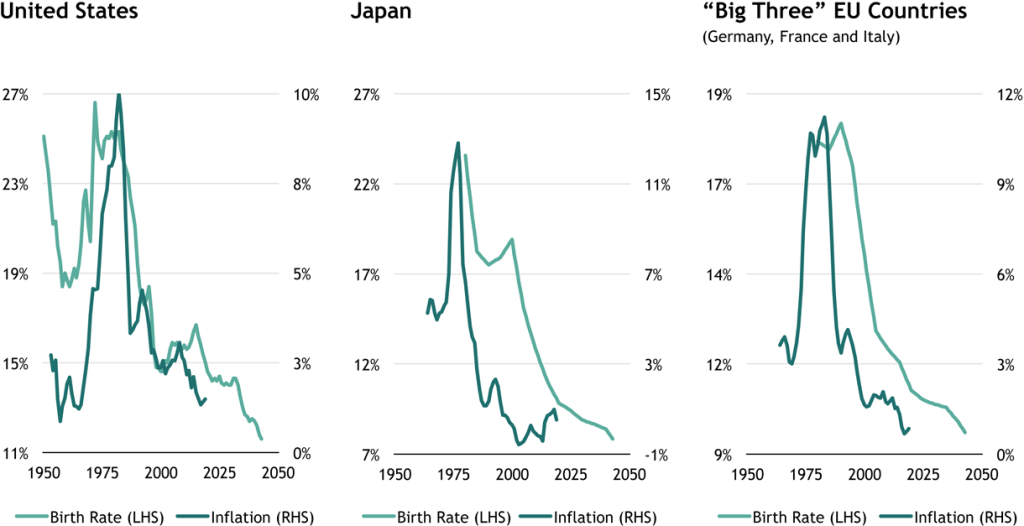
Secular headwinds We view aging demographics as inherently disinflationary. “Abenomics” in Japan represented a decade of tight coordination between fiscal and monetary authorities, yet deflation ruled. The ink just dried on Europe’s integration of fiscal and monetary policy coordination through deeply negative interest rates coupled with new EU-wide debt to finance deficits. Even so, Europe faces deflation, which shows no sign of reversing soon. The Fed is hanging its hopes on something being different in the US. However, the US, Europe and Japan have similarly aging populations and declining birthrates—two secular headwinds to both growth and inflation (see Figure 1).
Figure 1 – Historical Birthrate and Inflation

Source: Haver Analytics, World Bank, United Nations and Blackstone Investment Strategy. Birth rates represent “crude birth rate” (births per 1,000 population), 25-year lead. Inflation represents five-year average CPI for each country.
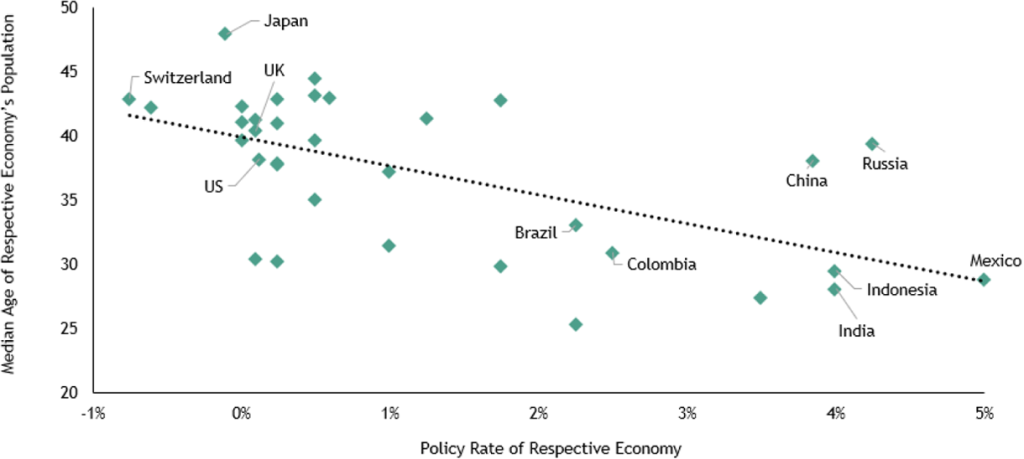
Japan is further along the aging curve than the US, but when Japan’s inflation peaked in 1991, the median age was 37.3. When the US inflation rate peaked in 2012, the median age was nearly identical at 37.4. The countries with the oldest populations are the ones with the lowest interest rates (see Figure 2) and the greatest holdings of negative-yielding debt. This is no coincidence.
Figure 2 – Relationship between Population’s Median Age and Interest Rates

Source: United Nations World Population Prospects, Bank for International Settlements and Blackstone Investment Strategy. Population data as of 2019, policy rate data as of 7/31/20.
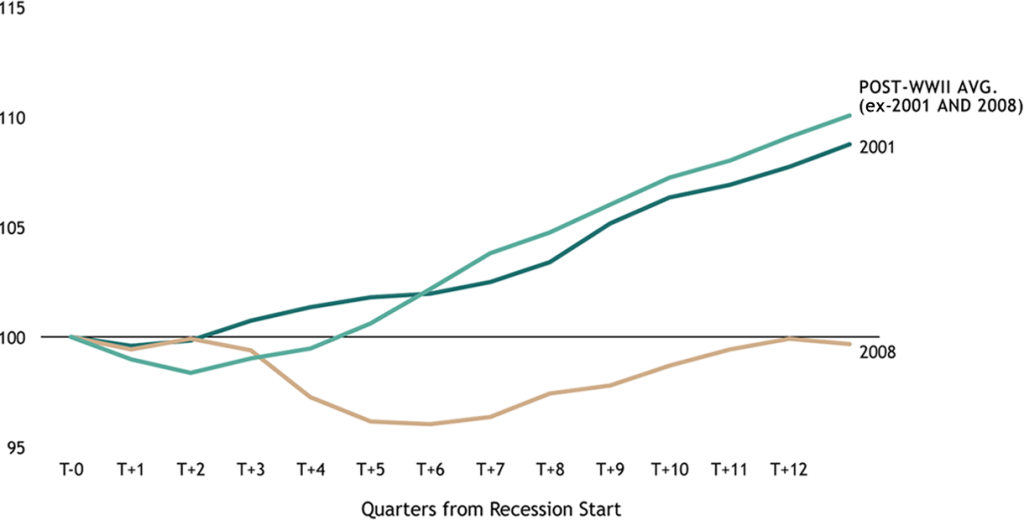
Upside risk from a “V” or a “Super V” We can’t rule out a quicker return to normalized interest rates if a “V-shaped” recovery takes hold. Record fiscal and monetary stimulus combined with improving consumer confidence gives economic bulls a persuasive argument, and perhaps explains the above-consensus September retail sales report. Those retail figures did much to shift the consensus toward the view that the recovery is “V-shaped” (or even, as some are calling it, a “Super V”). However, the Global Financial Crisis resulted in unprecedented monetary stimulus and deficit spending at the time, yet the ensuing recovery was the weakest in post-war history (see Figure 3). There is an upside risk to our view for this cycle, but stimulus doesn’t determine the strength of a recovery.
Figure 3 – Number of Quarters for US GDP to Recover Prior Peak after Recessions
(indexed to 100 at GDP peak)

Source: Bureau of Economic Analysis and Blackstone Investment Strategy. Represents real GDP, SAAR, in 2012 US$.
An aging society may very well forfeit faster-growth recoveries in exchange for prolonged, lower-growth cycles. Yes, the last recovery was the weakest in recent history, but it was also the longest. If Fed officials are as resilient in maintaining zero rates and other forms of monetary policy as we expect, and a flat-but-elongated recovery ensues, then US interest rate policy will follow that of Europe and Japan in being lower for longer. For investors, the effects will be significant. This policy is likely to 1) drive valuations higher even as profits growth lags, 2) create asset price inflation rather than inflation in the real economy and 3) make yield an increasingly scarce resource in portfolios.
It’s Not a 60/40 World Anymore
Equity performance is likely to be challenged and lower fixed income yields will fail to act as the traditional ballast against volatility. Byron and I believe that a traditional 60/40 portfolio of stocks and bonds won’t deliver the yield, or the performance, investors require.
Tailwinds for equities dissipate Equity returns over the last cycle benefited from falling interest rates, declining taxes, greater globalization and share buybacks. As we’ve argued in these pages before, those four tailwinds drove record stock outperformance—17% per annum for the S&P 500® over the course of the last expansion. But today these tailwinds are reversing.2 Interest rates may not go up, but we don’t believe they will fall much further, either. Corporations aren’t likely to benefit from further declines in corporate tax rates. Persistent trade wars and geopolitical tensions have governments and corporations rethinking supply chains and the benefits of globalization. And greater debt combined with less financial flexibility should reduce share buybacks. We agree with Blackstone’s Executive Vice Chairman Tony James, who recently said in an interview that public markets might be at risk of a “lost decade” of equity returns.
Challenges rise in fixed income Traditional fixed income won’t produce the diversification benefit, yield or total return that investors have come to expect. With ever-declining coupons in the public liquid markets, there’s less protection from volatility. The yield to worst for the Barclays Aggregate Bond Index averaged nearly 2.6% over the last cycle. Today, it’s just under 1.2%.3 As a result, the income from a traditional portfolio allocation of 60% stocks and 40% bonds is down to just 1.5% per annum, compared to 3.5% per annum when we exited the Global Financial Crisis in 2010.4 To find yield, some investors are seeking lower-quality debt in liquid public markets. In August, a below-investment grade company issued a 10-year non-call bond with a 2⅞ coupon. For comparison, that was the same yield on a 10-year Treasury in December 2018. Even in investment grade debt there are hidden risks to consider, as the underlying credit quality of most of the debt in the IG space is now BBB- rated, the lowest grade possible.
Alternative Asset Class Case Studies
Private credit Historically, private credit has offered higher income and lower losses than other fixed income segments, including senior loans and high yield bonds. First, privately originated loans are not only senior secured (and thus relatively senior in the capital structure), they also typically have call protection and covenants in place. Second, private credit has historically featured a low average realized loss rate; for 2005-2019, it was just 0.3%, versus 1.4% for high yield bonds and 1.0% for senior loans.5 Third, private credit is negatively correlated to investment grade credit (-0.21) and has had almost no correlation to high yield bonds (0.06) over the past 15 years.5 Also, the floating rate element of private credit translates into LIBOR floors should rates remain low. While yields will likely come down across all assets, the yield spread between private credit and public may persist. Today, private credit is about 20% of the total value of credit markets today and growing.5
Private real estate Over the last 10 years, private real estate produced an average yield of 5%, compared to 4.4% for public REITs, and a 2.5% annual yield for investment grade bonds.6 We believe investor demand together with declining real estate financing costs will continue to push real estate cap rates down; still, the relative yield pick-up for real estate should remain. Mid-sized cities in the South and Southwest have attractive fundamentals and will continue to benefit from outmigration from the denser, higher-cost Northeast and Midwest. Further, COVID has accelerated e-commerce growth; recent retail sales highlighted a 20%+ year-over-year growth rate. Logistics and warehouses should continue to outperform traditional retail given what we expect will be a permanent uptick in e-commerce demand even in a post-COVID world. The US simply has too much physical retail space.
Collateralized loan obligations With around $850 billion in assets outstanding, the CLO market is a growing global market.7 These products securitize corporate loans made to mid-size and large businesses, pool them together in actively managed portfolios, and then pass the interest payments to various classes of debt holders and owners in the securitization. Historical barriers to entry and illiquidity mean that CLOs pay a premium over more-conventional, liquid securities. As of early October, in the US, the spread for AA CLOs was 200bps over risk-free rates, compared to investment grade at 146bps.8 A rated CLOs yielded almost 285bps over risk-free rates.8 Spreads were similar for European CLOs.8
Higher-quality midstream It’s time to reconsider high-quality midstream C-Corps and Master Limited Partnerships (MLPs). In the decade following the Global Financial Crisis, the average spread between the dividend yield of the Alerian MLP Index and the yield on the US 10-year Treasury was approximately 4.6%.9 But given where rates are today, that spread widened out to over 14% by the end of 3Q’20.9 While a 14% dividend yield overall might seem unsustainable, a distinction exists between higher-quality and lower-quality MLPs, and the weakest names have already seen dividend cuts. Non-investment grade Gathering and Processing (G&P) facilities have faced challenges related to the COVID demand dislocation. By contrast, high-quality, investment grade names screen attractively relative to the critical services that the assets provide, e.g., transporting molecules for power generation and plastics production. We believe that the business environment is stabilizing for higher-quality issuers, all while midstream infrastructure distribution coverage ratios are at record levels.10
In our view, a lack of inflation will continue to suppress yields, and coordinated fiscal and monetary stimulus will drive debt and deficits higher. However, aging demographics will prevent inflation from taking hold. In that struggle between asset price inflation and real economy disinflation, Byron and I expect that a future of persistently lower yields will shine a positive light on alternative forms of yield.
With data and analysis by Taylor Becker.
- Source: New York Times, https://www.nytimes.com/2019/12/09/business/paul-a-volcker-dead.html
- Source: Bloomberg, represents annualized gross returns for the period 7/1/09 through 1/31/20.
- Source: Bloomberg, as of 10/23/20.
- Source: Bloomberg, as of 10/23/20. “Traditional portfolio mix” refers to a model portfolio with 60% allocation to the S&P 500 Index and 40% allocation to the Bloomberg Barclays U.S. Aggregate Bond Index.
- Source: Morningstar, Cliffwater and JPM Default Monitor, as of 12/31/19. “Private Credit” is represented by the Cliffwater Direct Lending Index. “Senior Loans” is represented by the S&P/LSTA Leveraged Loan Index. “High Yield” is represented by the Bloomberg Barclays High Yield Index. Average realized loss is the historical average of the realized gains/losses for the Cliffwater Direct Lending Index.
- Source: Morningstar Direct and NCREIF, as of 12/31/19.
- Source: BofA Global Research, Citi and Intex, as of 9/30/20.
- Source: BAML and Credit Suisse, as of 10/2/20; European Assets: BAML, Credit Suisse, Bloomberg Barclays as of 10/2/20.
- Source: Bloomberg, as of 9/30/20. Decade average spread for the period 1/1/10 through 12/31/19.
- Source: Wells Fargo Research “Midstream Monthly Outlook”, as of 8/3/20
The views expressed in this commentary are the personal views of Joe Zidle, Byron Wien, and Tony James and do not necessarily reflect the views of The Blackstone Group Inc. (together with its affiliates, “Blackstone”). The views expressed reflect the current views of Joe Zidle, Byron Wien, and Tony James as of the date hereof, and none of Joe Zidle, Byron Wien, Tony James nor Blackstone undertake any responsibility to advise you of any changes in the views expressed herein.
Blackstone and others associated with it may have positions in and effect transactions in securities of companies mentioned or indirectly referenced in this commentary and may also perform or seek to perform services for those companies. Blackstone and others associated with it may also offer strategies to third parties for compensation within those asset classes mentioned or described in this commentary. Investment concepts mentioned in this commentary may be unsuitable for investors depending on their specific investment objectives and financial position.
Tax considerations, margin requirements, commissions and other transaction costs may significantly affect the economic consequences of any transaction concepts referenced in this commentary and should be reviewed carefully with one’s investment and tax advisors. All information in this commentary is believed to be reliable as of the date on which this commentary was issued, and has been obtained from public sources believed to be reliable. No representation or warranty, either express or implied, is provided in relation to the accuracy or completeness of the information contained herein.
This commentary does not constitute an offer to sell any securities or the solicitation of an offer to purchase any securities. This commentary discusses broad market, industry or sector trends, or other general economic, market or political conditions and has not been provided in a fiduciary capacity under ERISA and should not be construed as research, investment advice, or any investment recommendation. Past performance is not necessarily indicative of future performance.


