Joe Zidle: Portfolio Rethink for a Stronger Recovery
Further COVID relief is on the horizon. Additional vaccine approvals are expected this month in the US, and rollout rates around the globe continue to improve. Experts do caution that new COVID strains could affect vaccine efficacy, attenuate immunity, and slow herd protection. However, our defenses against these new variants are much more advanced than they were 13 months ago. The process to fight COVID with mRNA vaccines has been standardized, and the logistics of vaccine creation, approval, and distribution are in place.
As we return to a more familiar world, the economy will begin an expansionary cycle from an unprecedented position of strength. With household savings high, debt service low, and corporate cash plentiful, we expect a period of growth not seen in the US for decades. Markets are brimming with confidence; record-high company valuations, record-low yields, and still-narrowing credit spreads reflect the consensus conviction in a strong recovery. However, stronger growth early in economic expansions is almost always linked to a steeper yield curve, which investors don’t seem to have priced in. In that sense, a strong, self-sustaining recovery that follows historical patterns might be the biggest risk they face in 2021.
The Early Cycle: Off and Running
Record federal deficits and continued quantitative easing (QE) by the Federal Reserve mean households and corporations have stronger balance sheets than at the start of any other cycle in history. Additionally, President Biden’s proposed stimulus plan earmarks approximately $350 billion in emergency aid to compensate state and local governments for revenue declines and to patch up near-term budget shortfalls.1 But due to the largesse of the CARES Act, few such shortfalls materialized in 2020, so any additional stimulus will leave states flush with cash. According to some estimates for 2020, state and local governments will post their first annual budget surplus since 1978.2
Like a thoroughbred at the gate Gone are the restraints typical at the start of a new cycle. Corporations don’t have to repair their balance sheets; in fact, profits are likely to hit a record this year. Unlike during most recessions, states didn’t have to lay off many employees because federal transfers are buttressing local budgets. And while some households will struggle to recover from pandemic unemployment, many are buoyed by record-high savings and ongoing stimulus from government transfers, creating unprecedented spending power.
COVID-related relief through administrative and legislative actions totals nearly $3.5 trillion to date, with trillions more available through Federal Reserve programs and Biden’s stimulus bill still up ahead.3 For comparison, the total contraction of US GDP in 2020, which only spanned the first two quarters, clocked in slightly above $2 trillion (see Figure 1).4
Figure 1: US GDP Contraction in 2020 and Federal Aid Response
(US$ in trillions)
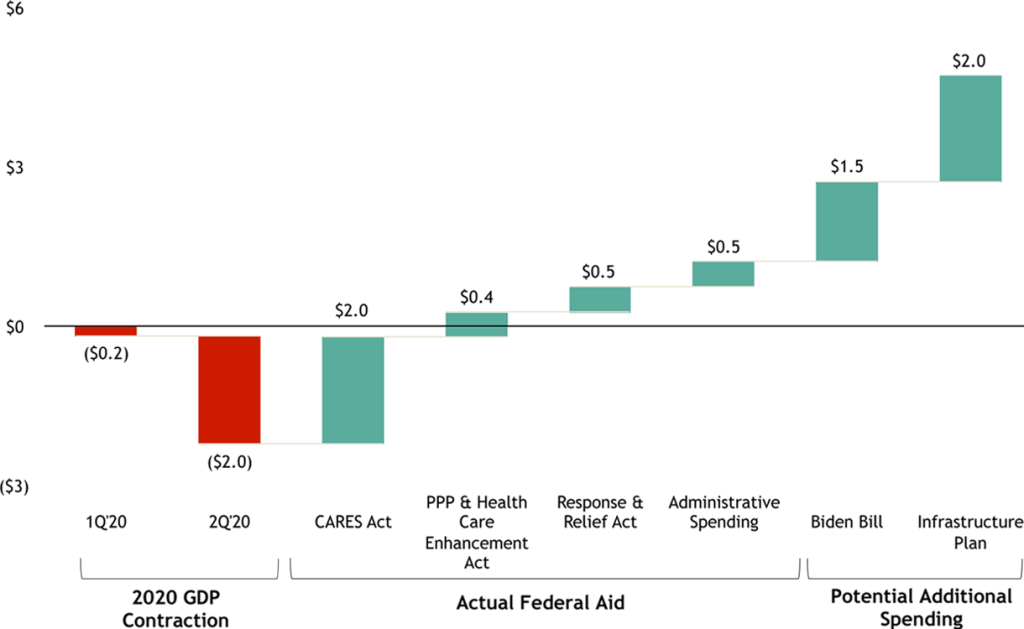
Source: Bureau of Economic Analysis, as of 12/31/20; Committee for a Responsible Federal Budget, as of 2/16/21. Note: “Actual Federal Aid” represents the amount committed or disbursed under each piece of legislation. “Potential Additional Spending” estimates based on projections for the amount of fiscal stimulus likely to be approved by Congress in 1Q’21 and on the Biden campaign’s estimate for a climate and infrastructure bill to be introduced later in 2021.
A “virtuous cycle” unfolds As we discussed in our January Market Insights, about 70% of personal consumption expenditure in the US goes to services, which garner a higher multiplier effect than goods. As the economy reopens, services spending will recover, with positive ramifications for domestic growth. During lockdowns in 2020, retail sales were supported by strong demand for goods like appliances and electronics, many of which are produced abroad. These sales were likely a driver of the United States’ trade deficit, which surged almost 18% over the course of last year.5 But with services, one person’s spending is another’s income. This creates a positive feedback loop in which spending begets more spending, the so-called virtuous cycle.
Reflation Now, Disinflation Later
The US economy faces several sources of inflationary pressure and volatility this year. We believe that this reflation will prove transient, though rising prices in 2H’21 may feel like a structural shift and a threat to the recovery.
Demand, capacity to dictate services prices The initial surge that we expect in consumer spending on services will likely contribute to short-term reflation. But it won’t just be the size of the spending that pushes up prices. Reduced capacity on the supply side over the past year will play a major role as well. Of the 10 million jobs that the US economy lost since February 2020, 3.9 million are in the services industry. In January 2021, the services industry unemployment rate was 15.9%.6 The total number of small businesses that are open in the leisure & hospitality sector is nearly 50% below its pre-COVID level, compared to 30% below for all small businesses.7
So while US consumers will be eager to leave the house to eat at restaurants and finally take that vacation, the services industry may initially be under-equipped to meet demand, pushing up prices. This supply crunch may also result in increased worker bargaining power over wages as businesses reopen and restore their employee base.
Figure 2: US Open Small Businesses
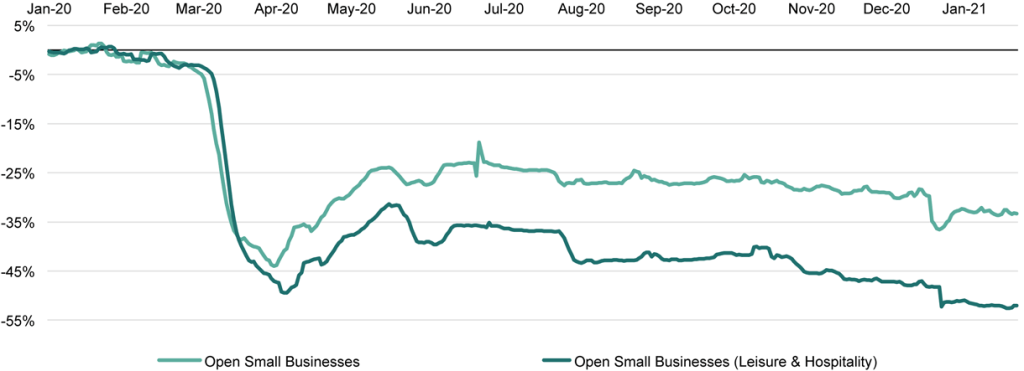
Source: Opportunity Insights Economic Tracker, as of 2/4/21
A floor in place, looking for a ceiling These reflationary dynamics will affect the bond market and interest rates. Typically, the Treasury yield curve steepens at the beginning of an economic cycle. In each of the last three cycles, the slope peaked within two years of the prior recession’s end (see Figure 3). Currently at about 100bps, the spread between 10-year and 2-year Treasury yields is in its 50th percentile since 1990, indicating that there is still plenty of room to climb.8
During this cycle, we expect 1% to serve as the 10-year yield’s floor. But it remains to be seen what the Fed considers to be an appropriate ceiling for the 10-year and what kind of yield curve controls it might implement to keep that ceiling intact. We don’t expect any such controls to be put in play with the curve only halfway up a historical steepening.
Figure 3: Historical 10-2 Year US Treasury Yield Spreads and Illustrative Forward Increase
(based on average of last three recessions)(1)
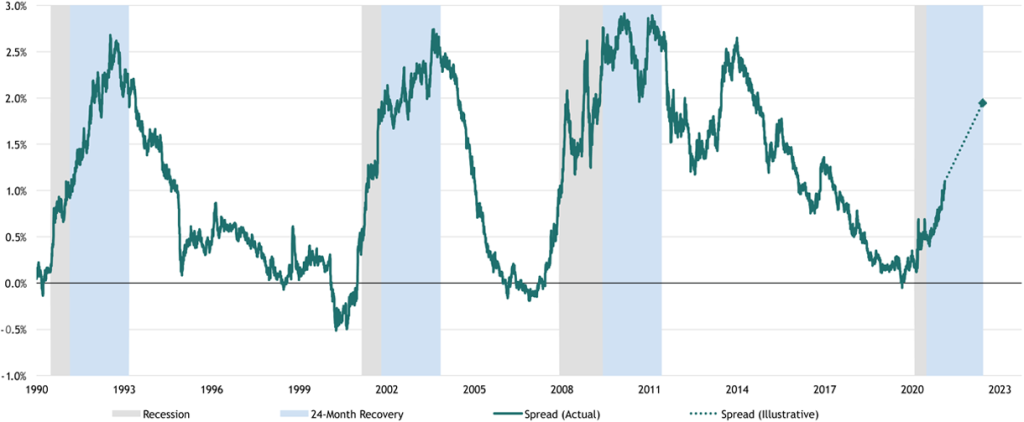
Source: National Bureau of Economic Research and Bloomberg, as of 2/12/21.
(1) Illustrative increase represents the average rise in the spread from recession start to 24 months after recession end over the last three recessions.
As the saying goes, don’t fight the Fed, because it’s likely to continue its QE program at least through the end of 2021. The QE will at least partially restrain the natural rise of long-dated Treasury yields that we would traditionally expect during a robust recovery. However, the Fed’s long-term policy goal is higher rates and 2% inflation. In August 2020, the Fed clarified its policy position to include temporary overshooting of its price benchmark to achieve an average of 2% “over time.”9
Today’s reflation won’t change long-term trends In our January Market Insights and our November 2020 essay on asset allocation, we noted that long-term deflationary pressures will likely overwhelm the shorter-term reflation expected over the next 4–6 quarters. The US has an aging population, a declining birth rate, and a shrinking workforce. As Japan and Europe have demonstrated, advanced economies facing these demographic headwinds tend to experience longer, slower expansions with low rates and disinflation.
As Fed Chair Powell noted in his January FOMC press conference, “The kind of troubling inflation that people like me grew up with seems far away and unlikely in the … domestic and global context that we’ve been in for some time.”10 Thus, the short-term reflation that we expect should be viewed as a growth spurt and source of volatility in the recovery’s adolescent phase, not a threat to its longevity.
The Risks of Climbing the Yield Curve
Interest rates tend to move inversely with equity multiples. The correlation between the S&P’s trailing P/E ratio and 10-year Treasury yields since 1962 is -56%, and the trendline between the two series over the same period suggests an almost one-to-one negative relationship. While a steepening yield curve is no guarantee that multiples will fall, equity valuation is unlikely to sustain a push far above its current level in the 99th percentile since 1954.11 In turn, the combination of lower equity multiples and higher Treasury rates cause bond prices to trade lower. Despite this risk, the bond market’s current record inflows, record-long duration, and increasingly low coupons suggest complacency with the protection offered by the excess liquidity in the market now and a widespread expectation that rates will remain exceptionally low throughout the recovery.
Long duration is a significant concern As of mid-February, a 100-basis point increase in the 10-year Treasury yield would result in a 10% price decline for traditional US investment-grade fixed income, according to a two-factor model decomposing index prices on average duration and the 10-year.12 Rising interest rates eat away at the purchasing power of future cash flows from fixed income investments—especially those with long duration, which currently include a large swath of the current corporate bond market.
While a return to low rates would buoy patient investors intent to wait out the current rates back-up, we think that the 10-year has already passed its floor for this cycle. As a result, a sustained steepening of the yield curve poses a significant threat to the returns of investors who extended duration in the search for yield.
Debt service will rise Conversely, a back-up in interest rates would result in more expensive interest payments for borrowers who might be subject to refinancing or rolling over existing debt, including corporations, consumers, and the federal government. The ratio of total nonfinancial debt to GDP hit 238% in 3Q’20, nearly double what it was in 1985.13 Over the same period, nonfinancial debt service as a percentage of GDP halved, ending 2020 at 6.1%.13
As a result, the effective interest rate being paid by borrowers on nonfinancial debt ended last year at a record-low 2.58%.13 Since 2000, nonfinancial debt service inched up from $1.0 trillion to $1.3 trillion, while total nonfinancial debt more than tripled to $50.3 trillion.14 A steepening yield curve and more painful interest rates could therefore have significant consequences for balance sheet health and future profitability.
Figure 4: US Total Nonfinancial Debt and Debt Service
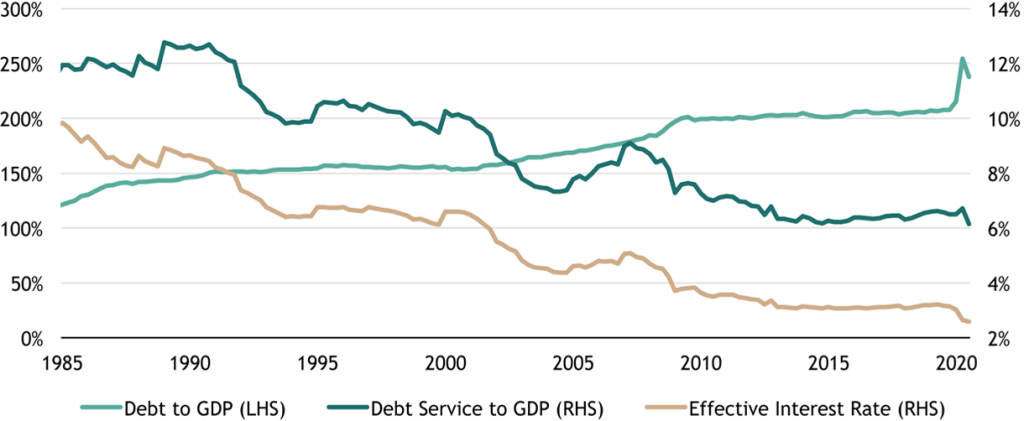
Source: Federal Reserve and Bureau of Economic Analysis, as of 9/30/20. “Nonfinancial” includes the federal government, nonfinancial corporations, and household and nonprofit organizations.
Unstoppable “zombies,” meet immovable debt This environment is particularly dangerous for the so-called zombie companies. Zombies struggle to cover their interest expenses but manage to shuffle along by maintaining access to credit markets and rolling over their obligations. The number of these firms operating in the US has grown over the past decade, fueled by accommodative monetary policy and ultra-low interest rates.15 Importantly, in 2020, total debt held by zombies almost doubled to $1.98 trillion as companies refinanced at rock bottom.15
Some of these companies will return to the land of the living as the economy reopens, demand recovers, and revenues rebound. However, in the medium term, the coming back-up in interest rates and the eventual tapering of the Fed’s bond-buying programs will have dire consequences for zombies’ ability to keep the party going when their mountain of precautionary cash needs to be rolled over. Additionally, the impact of the zombies’ 2020 low-rate debt binge on the economy remains to be seen. These companies represent a drag on spending, employment, and productivity, as they retain capital that could be allocated more efficiently elsewhere. Their debt-fueled survival of the pandemic may have only delayed their eventual failure, with negative repercussions for the economy’s health.
Early Cycle Portfolio Protection
In this environment, we believe that portfolios should consider shortening the modified duration of their fixed income holdings. Duration represents a measure of a bond’s sensitivity to rises in interest rates, which eat away at fixed income prices. A back-up in rates could have devastating consequences for investors left holding long-dated bonds. Instead, portfolios should pivot to bonds with shorter maturity dates or higher coupons, which have shorter durations. These bonds will offer better short-term protection against the rising rates and reflation that we expect in 2H’21.
Debt instruments with floating rates should also be an attractive option for many investors relative to fixed rate income. As rates back up, investors stuck earning fixed coupons pegged to ultra-low interest rates will feel the pain, especially if those coupons are paid out by long-duration assets. Floating rates are a way to hedge investor risk against a steeper yield curve without exiting the bond market entirely.
As investors seek alternatives to traditional fixed income, real assets are another option to consider. In the coming cycle, we expect that industrial and logistics real estate and infrastructure development will continue to experience strong sector-level growth while providing portfolio protection against reflationary dynamics.
In the same vein, investors should prefer high-quality companies and industries with market pricing power, secular tailwinds, and the ability to grow dividends. Higher rates and a higher cost of capital are likely to drive greater differentiation among companies and shift market focus back to fundamentals. When that happens, pricing and performance will increasingly depend on company fundamentals, strong management teams, and expected future cash flows.
The current bull market is the product of plentiful liquidity from generous fiscal stimulus and lax monetary policy. But these dynamics will change as the economy reopens, COVID stimulus ends, and rates climb higher. Investors should be prepared.
With data and analysis by Taylor Becker.
- Bloomberg. https://www.bloomberg.com/news/articles/2021-01-15/biden-plan-rescues-states-cities-from-pandemic-s-financial-toll
- Strategas, as of 2/16/21.
- Committee for a Responsible Federal Budget, as of 2/16/21. https://www.covidmoneytracker.org/
- Bureau of Economic Analysis, as of 12/31/20.
- Census Bureau, as of 2/5/21.
- Bureau of Labor Statistics, as of 2/5/21.
- Opportunity Insights Economic Tracker, as of 10/22/20 (employment) and 12/20/20 (small businesses). https://www.tracktherecovery.org/
- National Bureau of Economic Research and Bloomberg, as of 2/12/21.
- Federal Open Market Committee. https://www.federalreserve.gov/newsevents/pressreleases/monetary20200827a.htm
- Federal Reserve. https://www.federalreserve.gov/mediacenter/files/FOMCpresconf20210127.pdf
- Bloomberg and Blackstone Investment Strategy calculations, as of 1/29/21.
- Bloomberg and Blackstone Investment Strategy calculations, as of 2/10/21.
- Federal Reserve, Bureau of Economic Analysis, and Blackstone Investment Strategy calculations, as of 9/30/20.
- Federal Reserve, as of 9/30/20.
- Bloomberg. https://www.bloomberg.com/news/articles/2020-11-17/america-s-zombie-companies-have-racked-up-1-4-trillion-of-debt
The views expressed in this commentary are the personal views of Joe Zidle and do not necessarily reflect the views of The Blackstone Group Inc. (together with its affiliates, “Blackstone”). The views expressed reflect the current views of Joe Zidle as of the date hereof, and neither Joe Zidle, nor Blackstone undertake any responsibility to advise you of any changes in the views expressed herein.
Blackstone and others associated with it may have positions in and effect transactions in securities of companies mentioned or indirectly referenced in this commentary and may also perform or seek to perform services for those companies. Blackstone and others associated with it may also offer strategies to third parties for compensation within those asset classes mentioned or described in this commentary. Investment concepts mentioned in this commentary may be unsuitable for investors depending on their specific investment objectives and financial position.
Tax considerations, margin requirements, commissions and other transaction costs may significantly affect the economic consequences of any transaction concepts referenced in this commentary and should be reviewed carefully with one’s investment and tax advisors. All information in this commentary is believed to be reliable as of the date on which this commentary was issued, and has been obtained from public sources believed to be reliable. No representation or warranty, either express or implied, is provided in relation to the accuracy or completeness of the information contained herein.
This commentary does not constitute an offer to sell any securities or the solicitation of an offer to purchase any securities. This commentary discusses broad market, industry or sector trends, or other general economic, market or political conditions and has not been provided in a fiduciary capacity under ERISA and should not be construed as research, investment advice, or any investment recommendation. Past performance is not necessarily indicative of future performance.
