Private Credit, Meet “Higher for Longer”
We recently lost the remarkable Byron Wien at age 90, an icon on Wall Street whose wisdom continues to inspire us, as captured in his Life Lessons. His presence will be deeply missed.
Finding opportunities over the past 18 months has been anything but easy. High inflation had the Fed hiking interest rates at its quickest pace in decades and transitioning from quantitative easing (QE) to quantitative tightening (QT).1 Uncertainty about future rate hikes, economic growth, and consumer strength turned the 10-year term premium positive.2 Ten-year yields reached new highs amid some of the most volatile swings in its recent history. The traditional 60/40 portfolio provided insufficient diversification, as the stock-bond correlation turned positive in October 2022.3
These conditions have many investors wondering where else they can go. At Blackstone, we believe that these macroeconomic conditions have the potential to create a favorable market for private credit. And history tells us that private credit can bring meaningful diversification to portfolios, including the 60/40.4 To discuss the opportunities in this rising asset class and how to navigate the benefits and challenges of higher-for-longer rates, I welcome, as indicated below, the perspectives of Jonathan Bock, Co-CEO of Blackstone’s Business Development Companies (BDCs) and Global Head of Market Research for Blackstone Credit.
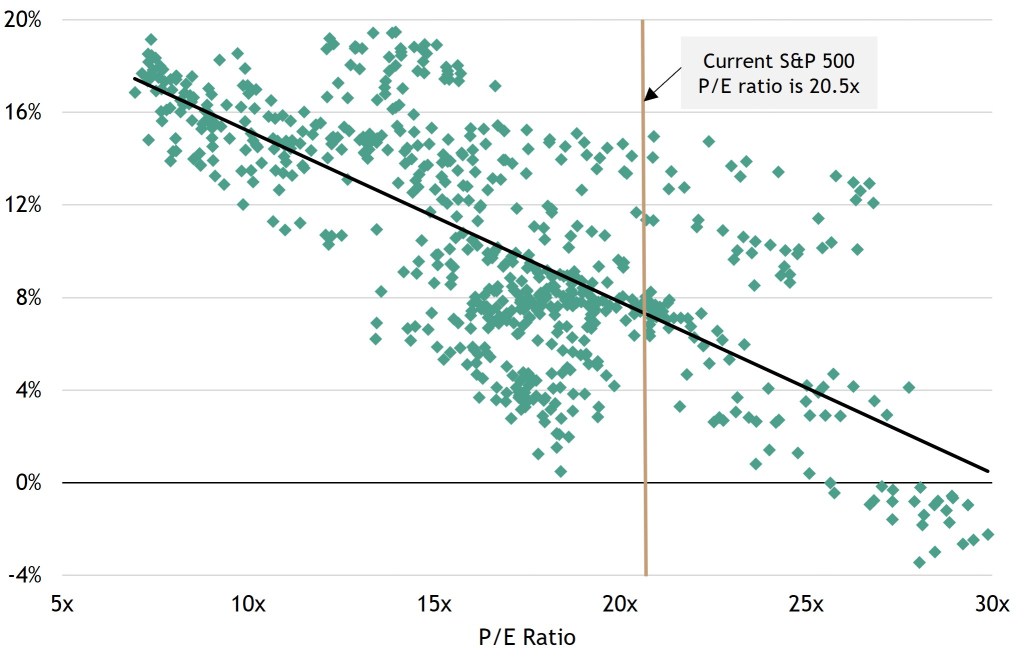
Equity returns enter a different era Although the S&P has returned an impressive 19% year-to-date through November 15, seven mega-cap tech stocks (+72%) are largely responsible; the other 493 stocks in the index are up only 7%.5 S&P 500 valuations remain elevated, and history shows that subsequent 10-year annualized returns at these levels have historically resulted in lower forward returns (Figure 1).
The last time P/E multiples were at this level, the index provided only a 7% annualized return over the next 10 years.6 Higher discount rates mean equity returns will likely trail those of recent prior cycles, and market risk is more likely to be a headwind in the QT era compared to the massive tailwind that was QE.
Figure 1: S&P Valuation and Forward 10-Year CAGR7
The Ronco “set it and forget it” days are over In a lower-return environment, with higher interest rates and volatility, investors will be challenged to add value while managing risk effectively. Simply owning the market won’t get it done anymore. During the QE era, market multiples worked in tandem with earnings growth to produce historic returns. From March 2009 when the S&P 500 traded at 13x earnings to August 2020 when it peaked at 23x, a passive investor in the market earned 16% per annum.8 Breaking down the total returns by source from December 2009 to December 2020 shows that 44% of the index’s average total return was from multiple expansion. We take a more muted view for the next cycle as multiple expansion was responsible for only 14% of the average annual total return from 1991 to 2008 when rates were both higher and more volatile.9
In a higher-rate environment, earnings growth will drive returns. We believe the relative strength of balance sheets, earnings predictability and cash flow growth are factors in an investment or asset class that will likely eclipse uncertain prospects of future multiple expansion in importance. Quality factors like these can offset some of the risks inherent in an environment of scarcer returns.
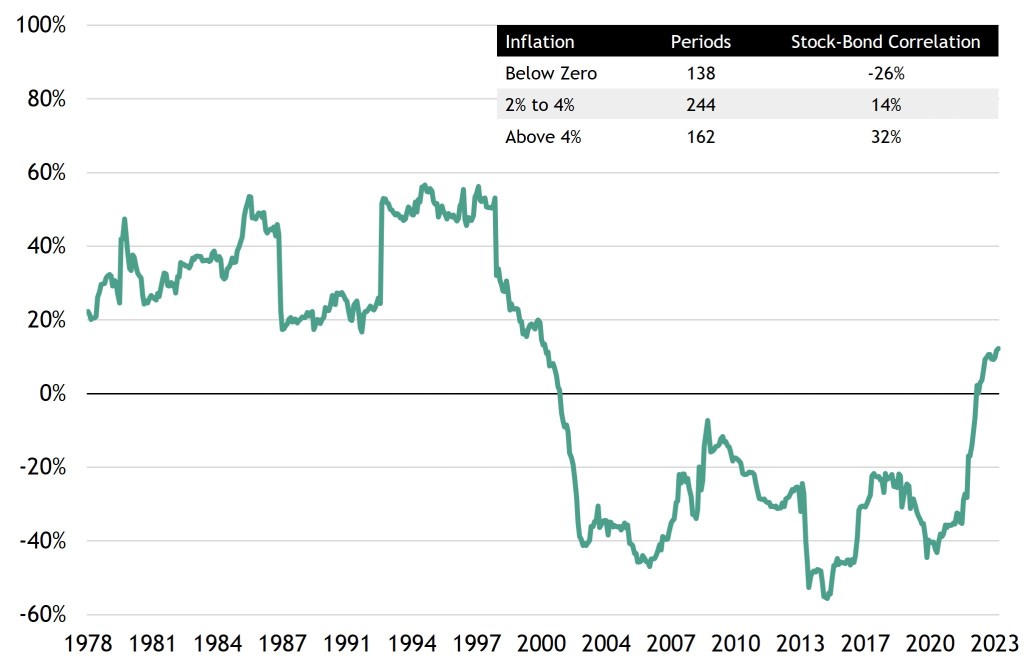
Given that positive stock-bond correlation is stronger during periods of elevated inflation, we believe that active portfolio management that incorporates private alternatives with low correlation to traditional public markets can create a more resilient strategy.
Figure 2: US Stock-Bond Correlation10
Private credit comes of age at a compelling time Market forces of supply and demand are aligning for private credit. Tighter lending conditions and the aftermath of Silicon Valley Bank’s (SVB) collapse caused traditional lenders to step back. With slower bank and leveraged loan growth, demand for partners in private credit is high. Private credit provided 65% of loans for the leveraged buyout (LBO) market in 2021 and 86% for the market as of year to date 2023.11
The private market offers transaction speed and certainty, allowing lenders to provide liquidity at the most senior portion of the capital structure with favorable covenants for investors. In addition to the tailwind provided by today’s market environment is the increase in diversification that has historically resulted from adding private credit to a 60/40 portfolio. From 2015 to 2023, a portfolio that added a 20% allocation to private credit reduced volatility, increased annualized returns, and added 140 basis points of income.12
Of course, not all private credit is created equal, as Jon discusses below. But because there will be winners and losers, skilled managers have an opportunity to stand out. Those managers experienced in due diligence with sufficient scale to build out funds with higher-quality collateral and low leverage in defensive sectors may be able to provide a better cushion. Others are likely to face pressure and more volatile outcomes in such an untested and uncertain macroenvironment.
Private Credit & The Art of Being Prepared
by Jonathan Bock, Co-CEO of Blackstone’s Business Development Companies (BDCs) and Global Head of Market Research for Blackstone Credit
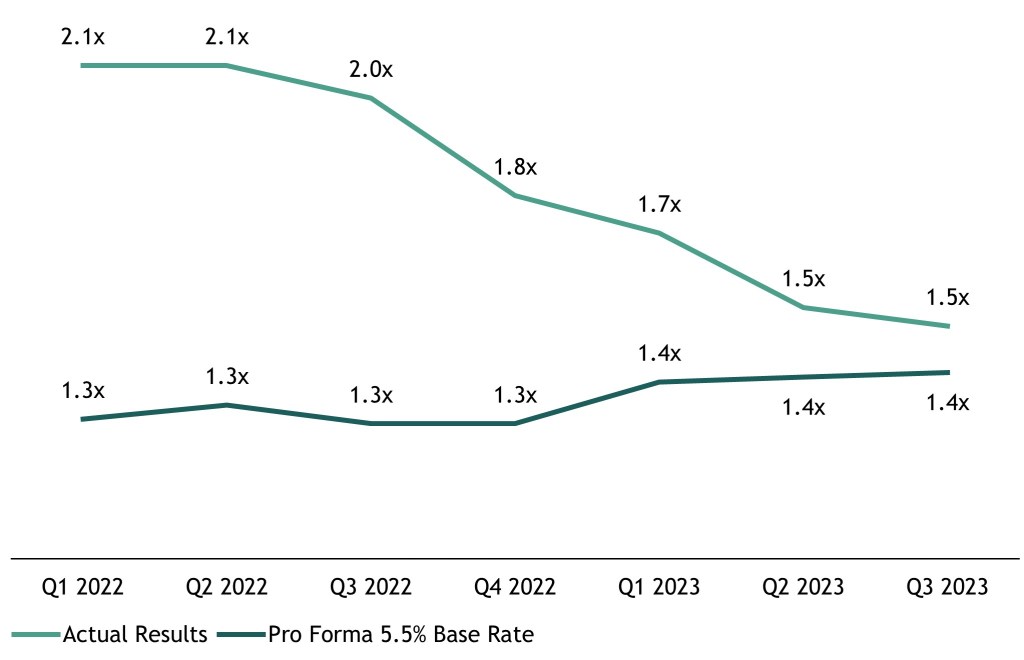
Investors are often reminded that “higher-for-longer” interest rates bring the prospect of higher investment yields, but they also place pressure on borrowers. Referencing the Lincoln International Private Market Database (“Lincoln”),13 allows investors to compare and contrast this point. Today, the private credit market operates at a current average interest coverage ratio (ICR) of 1.5x, although 17%13 of companies operate at an ICR below 1.0x when assuming current base rates. If we assume forward rates of 5.5%, the average ICR of the market is 1.4x, while 20%13 of companies have an ICR below 1.0x.
Figure 3: Interest Rate Coverage Ratios at Current and Future Rates13
As pressure on borrowers has the potential to increase, we believe this higher-for-longer rate environment creates meaningful dispersion amongst managers because not all private credit, and not all lending, is the same. In this report we will address how private credit managers can create high-conviction portfolios to mitigate risk in the event of persistent higher rates and a potential slowing economic backdrop.
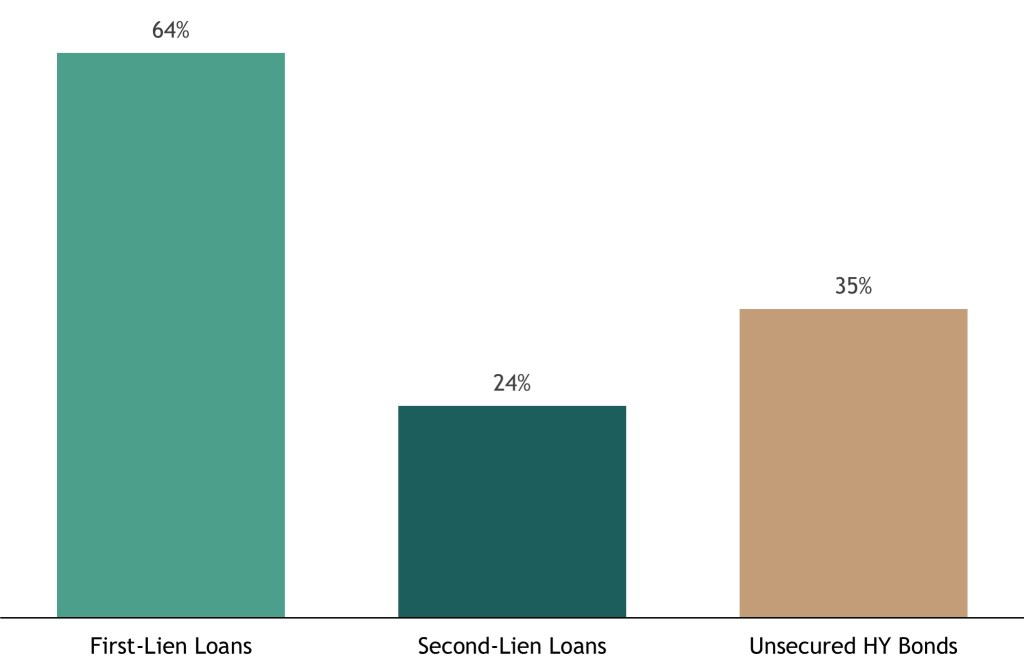
First, managers focus on first lien seniority When economic environments are uncertain or choppy, sitting up in the capital stack can be beneficial for investors. When investments underperform, the most senior capital sees materially higher recoveries than capital lower in the stack. This is evident in the liquid credit markets where first lien loans exhibited a 64% recovery rate vs. 24% for second-lien loans and 35% for unsecured HY bonds.
Figure 4: Leveraged Loan and High-Yield Bond Long Term Average Recovery Rates14
There is a homeowner analogy to make here. If you buy a house, the lender provides you money through a mortgage, and you provide the cash for the equity. In the private credit context, managers are like the lender. Private equity sponsors, the owners of the business, are like the homeowner, as they put in the cash equity. If the borrower were to hit a bump in the road, there’s a large built-in shock absorber. Conversely, if you sell your home, you must repay the mortgage before you get your equity out. That is what being senior secured means. Senior loans get repaid before equity owners get their money, which can provide a mitigant to loss in an uncertain economic environment.
Second, managers emphasize lower default sectors Higher rates will pressure borrowers and highlight, now more than ever, that not all private credit will perform the same – sector selection matters. We can see this dynamic in aggregate data from Lincoln, where private credit borrowers in more cyclical sectors are now experiencing default rates of 8% and year-over-year (YoY) cash flow growth of 2%. At the other end of the spectrum are those private credit borrowers in less cyclical sectors, which feature default rates of 3% and cash flow growth of 5% YoY.
Figure 5: Default Rates and Operating Profit Growth for Less Cyclical vs. More Cyclical Sectors15
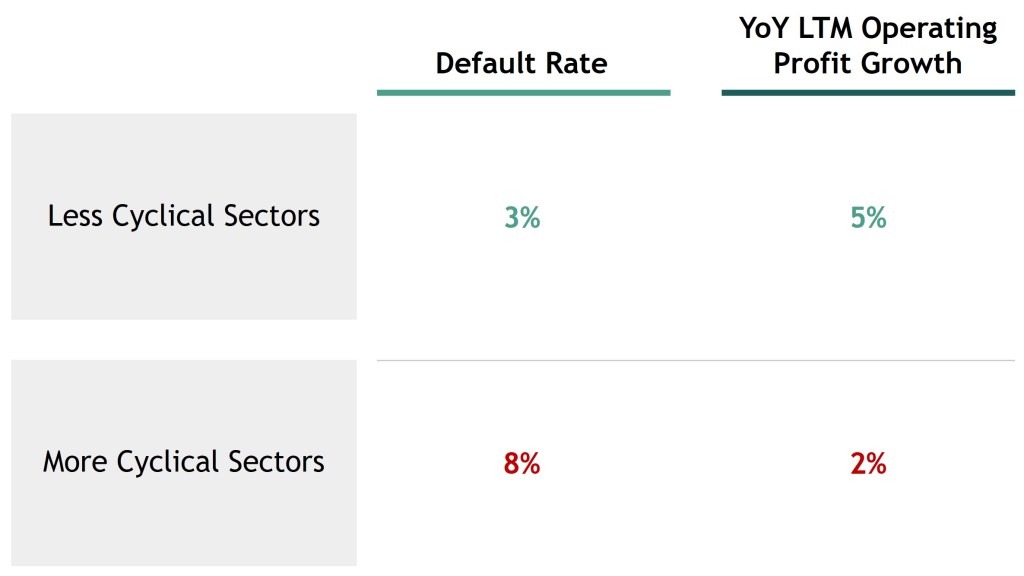
Importantly, certain managers may choose to focus on lower default sectors, with particular emphasis on stable revenue and low capital expenditure such as software, professional services, and healthcare.
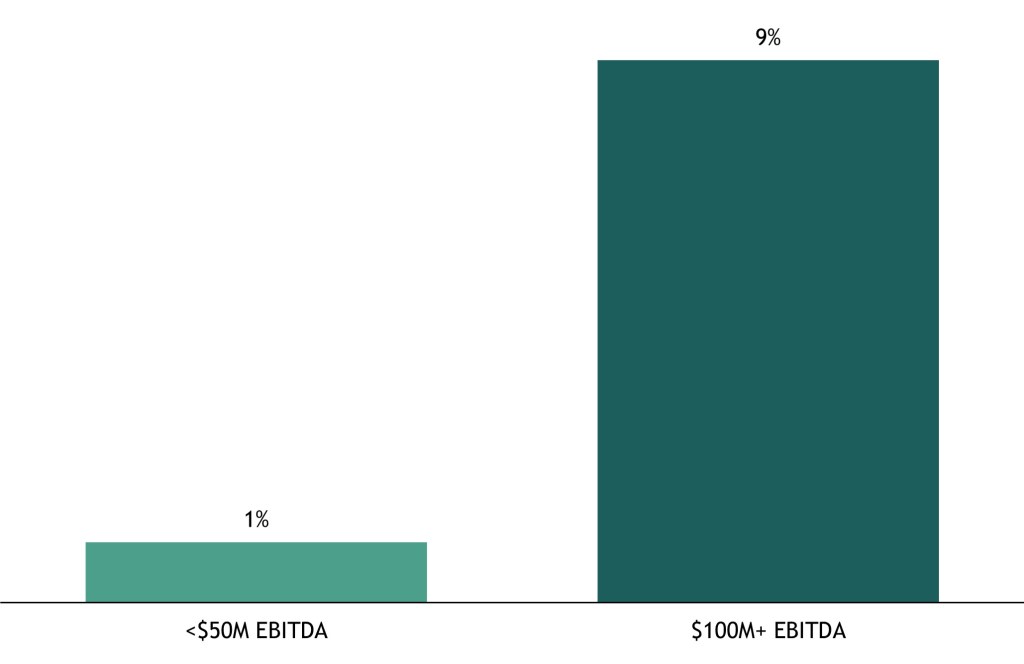
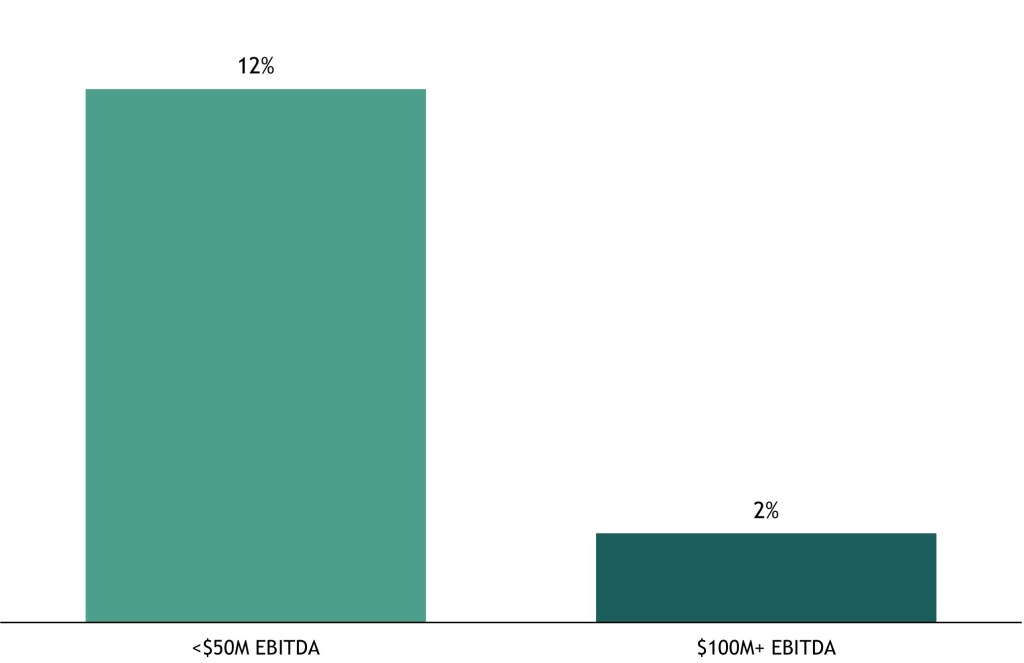
Third, managers invest in larger companies Larger companies are often more resilient in the face of economic headwinds than their smaller counterparts, and historically they have lower default rates.16 Empirical data on the private credit market shows that larger companies with $100 million in EBITDA and higher have grown LTM EBITDA at a 7x+13 greater rate and defaulted at a 5x+16 lower rate than their smaller counterparts measured at $50 million in EBITDA or less.
Figure 6:
Private Credit Market
LTM EBITDA Growth13
Private Credit Market
Average Quarterly Covenant Default Rate16
To us, the reasoning for this outperformance is relatively intuitive. Larger companies have greater human capital and financial resources with which to navigate changing economic conditions. A review of those companies in the private credit market provides further evidence to this point.
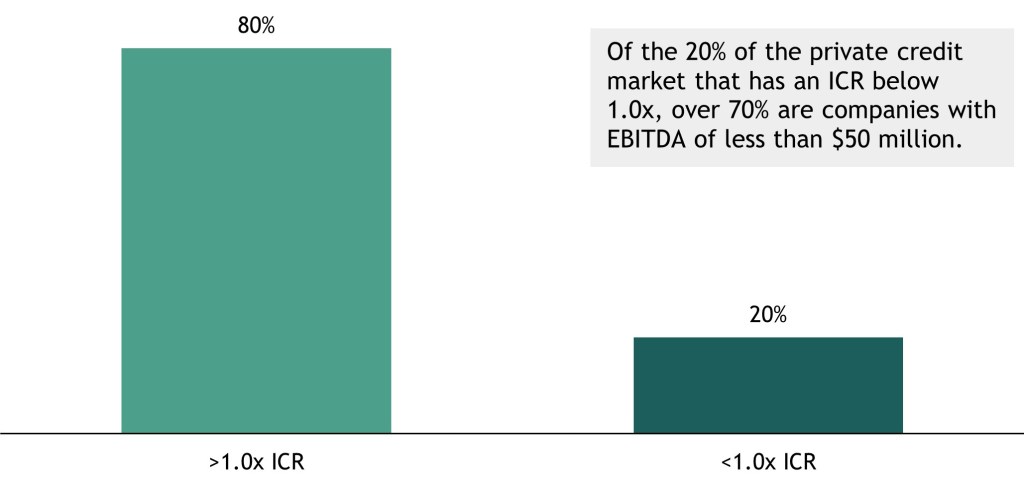
Today, nearly 20% of the private credit market has an ICR below 1.0x at 5.5% forward base rates, which implies that nearly 20% of the private credit market does not have sufficient cash flow to cover their debt. Of that 20%, over 70%13 are companies with $50 million in EBITDA or less. The pressure of higher rates does build, and we believe it will be felt first and most acutely by smaller businesses.
Figure 7: Private Credit Market Interest Coverage Ratios13
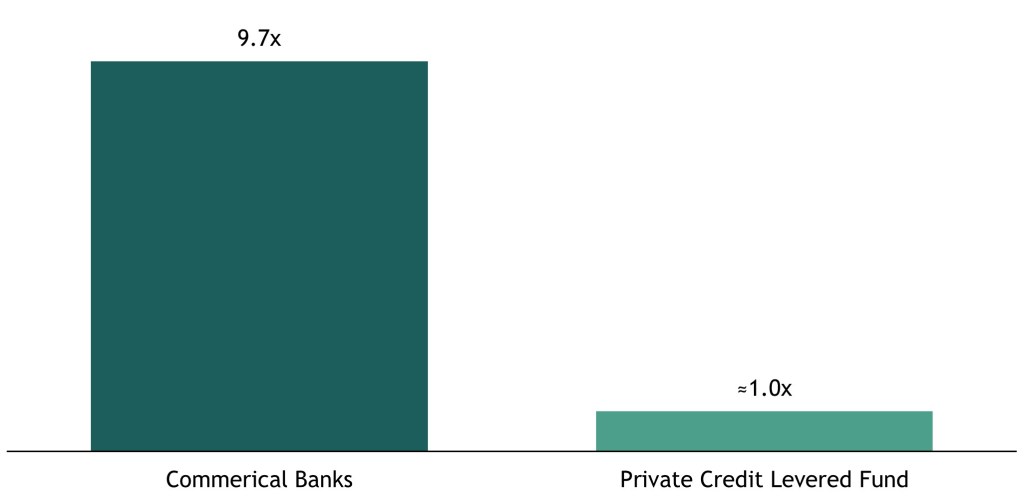
Lastly, managers generally maintain a low leverage profile A low leverage profile is a source of meaningful strength in today’s environment. First, a low fund leverage profile increases fund liquidity and/or capital available for investment. A low leverage profile also lowers fund risk in the event asset values fall or losses increase. Private credit funds tend to be levered ~1.0x or not at all, substantially lower than average leverage found in regional banks, currently levered at 9.7x.
Figure 8: Average Financial Leverage17
Ratio of Gross Debt and Deposits to Shareholders’ Equity
Overall, pressure in a higher-for-longer rate environment is building. Investment success for private credit in this environment is likely to be determined by how well a manager is prepared.
Past performance does not predict future returns. Commentary reflects Jonathan Bock’s views and beliefs as of November 2023. Diversification does not ensure a profit or protect against losses. Please refer to “Trends” and “Index Comparison”.
- Source: World Economic Forum.
- Term premium represents the additional compensation an investor requires to hold a bond amid greater interest rate uncertainty. See Joe Zidle’s last Market Insights here.
- As commonly used in the industry, the 60/40 portfolio is allocated 60% to the S&P 500 Index, and 40% to the Bloomberg US Aggregate Bond Index.
- Bloomberg and Standard & Poor’s. Based on the combination of a 5-year rolling correlation of 1-month changes in the S&P 500 and the Bloomberg US Government Bond Index from February 1978 to October 2023 (Figure 2).
- Standard & Poor’s, total returns (gross of dividends) as of 11/15/2023.
- Standard & Poor’s, forward price to earnings ratio and forward 10-year compounded annual growth rate using total returns (gross of dividends). “Forward 10-Year CAGR” is computed using monthly total returns (gross of dividends). “P/E Ratio” is the trailing 12-month price-to-earnings ratio. Historical sample size extends from January 1957 through October 2023. Each dot represents the S&P 500’s trailing 12-month price-to-earnings ratio for a given month and the index’s resulting forward CAGR over the next 10 years from that month.
- S&P Valuation and Forward 10-Year CAGR (Figure 1): Sources: Bloomberg and Standard & Poor’s. “Forward 10-Year CAGR” is computed using monthly total returns (gross of dividends). “P/E Ratio” is the trailing 12-month price-to-earnings ratio. Historical sample size extends from January 1957 through October 2023. Each dot represents the S&P 500’s trailing 12-month price-to-earnings ratio for a given month and the index’s resulting forward CAGR over the next 10 years from that month.
- Standard & Poor’s. Data are annualized monthly total returns (gross of dividends).
- Standard & Poor’s. Total returns (gross of dividends) by source are annual as of year-end.
- US Stock-Bond Correlation (Figure 2): Source: US Bureau of Labor Statistics and Bloomberg, as of 10/31/2023. Based on the combination of a 5-year rolling correlation of 1-month changes in the S&P 500 and the Bloomberg US Government Bond Index from February 1978 to October 2023. Above 4% measures 4% to 10% year-over-year growth in CPI. Inflation periods are defined as months during which the inflation criteria are met, with data going back to February 1973 (544 periods). Stock and bonds correlation are based on monthly percentage changes in the S&P 500 and Bloomberg US Government Bond Index for the specified inflation periods.
- Source: LCD data through September 30, 2023. Private credit count is based on transactions covered by LCD news. Represents periods of contrasting base rates.
- Bloomberg and Morningstar, as of 3/31/2023. Time period is based on earliest common inception. As commonly used in the industry, the 60/40 portfolio is 60% allocated to the S&P 500 Index and 40% is allocated to the Bloomberg US Aggregate Bond Index. Private Credit is represented by the Cliffwater Direct Lending Index. There can be no assurance that any Blackstone fund or investment will achieve its objectives or avoid substantial losses, or that alternative investments will generate higher returns than other investments. Annualized returns and volatility are calculated based on the quarterly returns over the period from October 2015 to March 2023. The yield on the portfolio with 20% private credit allocation was calculated using the annualized S&P 500 Dividend Yield, the annualized Bloomberg US Aggregate Bond Yield, and annualized Cliffwater Direct Lending Index quarterly income. The information herein is provided for educational purposes only and should not be construed as financial or investment advice, nor should any information in this document be relied on when making an investment decision. Opinions expressed reflect the current opinions of Blackstone as of the date hereof and are based on Blackstone’s opinions of the current market environment, which is subject to change. Past events and trends do not imply, predict or guarantee, and are not necessarily indicative of, future events or results.
- As of September 30, 2023. The “Lincoln International Private Market Database,” also known as the Lincoln Valuations & Opinions Group (“VOG”) Database, is a quarterly compilation of over 4,750 portfolio companies from a wide assortment of private equity investors and non-bank lenders. Most of these companies are highly levered with debt financing provided via the direct lending market and in many instances, Lincoln estimates the fair value of at least one senior debt security in the portfolio companies’ capital structures. In assessing the data, VOG relies on commonly accepted valuation methodologies and each valuation analysis is unique and conforms to fair value accounting principles. The analyses are then vetted by auditors, fund managers and their board of directors, as well as other regulators. © 2023 Lincoln Partners Advisors LLC. All rights reserved. Third party use is at user’s own risk.
- Recovery rates by asset type are issuer-weighted and based on prices 30 days after the default date. The long-term average for First-Lien and Second-Lien Loans corresponds to the past 24 years as of 8/31/2023, which is the term published by J.P. Morgan. The long-term average for Unsecured High-Yield Bonds corresponds to the past 25 years as of 8/31/2023, which is the term published by J.P. Morgan.
- Source: Lincoln International Private Market Database as of June 30, 2023. Lincoln segments the private credit market in five industries: healthcare, business services, TMT (technology, media & telecom), industrials, and consumer. Categorization of “less cyclical” and “more cyclical” is based on Blackstone Credit views and beliefs. Blackstone Credit views cyclical sectors as industries that are sensitive to factors such as economic and business cycles and experience fluctuations in demand profitability. Less cyclical sectors include healthcare, business services, and TMT (technology, media & telecom). More cyclical sectors include consumer and industrials. Default rate reflects covenant default rate in Q2’23 and where multiple sectors are combined, shows an average among the sectors.
- As of September 30, 2023. The “Lincoln International Private Market Database,” also known as the Lincoln Valuations & Opinions Group (“VOG”) Database, is a quarterly compilation of over 4,750 portfolio companies from a wide assortment of private equity investors and non-bank lenders. Most of these companies are highly levered with debt financing provided via the direct lending market and in many instances, Lincoln estimates the fair value of at least one senior debt security in the portfolio companies’ capital structures. In assessing the data, VOG relies on commonly accepted valuation methodologies and each valuation analysis is unique and conforms to fair value accounting principles. The analyses are then vetted by auditors, fund managers and their board of directors, as well as other regulators. © 2023 Lincoln Partners Advisors LLC. All rights reserved. Third party use is at user’s own risk. Average Quarterly Covenant Default Rate represented as the average quarterly share of companies in the Lincoln International proprietary database that have breached at least one covenant for the period June 30, 2018 through September 30, 2023, which is the full sample for which data is currently available. Average quarterly covenant default rates for companies with fewer than $50 million in EBITDA and greater than $100 million in EBITDA were 12% and 2%, respectively, in the noted time period.
- Regional banks reflects KBW Regional Banking Index as of October 8, 2023, which seeks to reflect the performance of U.S. companies that do business as regional banks or thrifts. Reflects latest available company financials as of November 3, 2023. Calculating leverage as (Deposits + Debt) / Shareholder Equity results in 8.9x Leverage Ratio.
None of the information contained herein constitutes an offer to sell, or a solicitation of an offer to buy, any security or instrument, or a solicitation of interest in any Blackstone vehicle, account or strategy. If any such offer is made, it will only be by means of an offering memorandum or prospectus, which would contain material information including certain risks of investing including, but not limited to, loss of all or a significant portion of the investment due to leveraging, short-selling, or other speculative practices, lack of liquidity and volatility of returns. Nothing herein constitutes investment advice or recommendations and should not be relied upon as a basis for making an investment decision.
Recipients should bear in mind that past performance does not predict future returns and there can be no assurance that a fund will achieve comparable results, implement its investment strategy, achieve its objectives or avoid substantial losses or that any expected returns will be met.
The views expressed in this commentary are the personal views of Joe Zidle and Jonathan Bock and do not necessarily reflect the views of Blackstone Inc. (together with its affiliates, “Blackstone”). All information in this commentary is believed to be reliable as of the date on which this commentary was issued, and has been obtained from public sources believed to be reliable. No representation or warranty, either express or implied, is provided in relation to the accuracy or completeness of the information contained herein.
Investment concepts mentioned in this commentary may be unsuitable for investors depending on their specific investment objectives and financial position. Tax considerations, margin requirements, commissions and other transaction costs may significantly affect the economic consequences of any transaction. Concepts referenced in this commentary can and should be reviewed carefully with one’s investment and tax advisors.
Index Comparison. The volatility and risk profile of the indices presented in this document is likely to be materially different from that of the fund. In addition, the indices employ different investment guidelines and criteria than the fund and do not employ leverage; as a result, the holdings in the fund and the liquidity of such holdings may differ significantly from the securities that comprise the indices. The indices are not subject to fees or expenses and it may not be possible to invest in the indices. A summary of the investment guidelines for the indices presented are available upon request. In the case of equity indices, performance of the indices reflects the reinvestment of dividends.
No Assurance of Investment Return. Prospective investors should be aware that an investment in a fund is speculative and involves a high degree of risk. There can be no assurance that a fund will achieve comparable results, implement its investment strategy, achieve its objectives or avoid substantial losses or that any expected returns will be met. A fund’s performance may be volatile. An investment should only be considered by sophisticated investors who can afford to lose all or a substantial amount of their investment. A fund’s fees and expenses may offset or exceed its profits.
Third-Party Information. Certain information contained herein has been obtained from sources outside Blackstone, which in certain cases have not been updated through the date hereof. While such information is believed to be reliable for purposes used herein, no representations are made as to the accuracy or completeness thereof and none of Blackstone, its funds, nor any of their affiliates takes any responsibility for, and has not independently verified, any such information. In particular, you should note that, since many investments of the Funds may be unquoted, net asset value figures in relation to funds may be based wholly or partly on estimates of the values of such funds’ investments provided by the originating banks of those underlying investments or other market counterparties, which estimates may themselves have been subject to no verification or auditing process or may relate to a valuation at a date before the relevant net asset valuation for such fund, or which have otherwise been estimated by Blackstone.
Trends. There can be no assurances that any of the trends described herein will continue or will not reverse. Past performance does not predict future returns.


