
Advisor Pulse – Fall 2024
The latest views from financial advisors surveyed globally1
Over 80% of advisors believe private market investments attract new clients
Did you know?
Acquiring new clients is often an advisor’s greatest challenge. Offering private market investments can differentiate advisors from the competition and help draw high-net-worth individuals.2
Do private market investments help attract new clients?

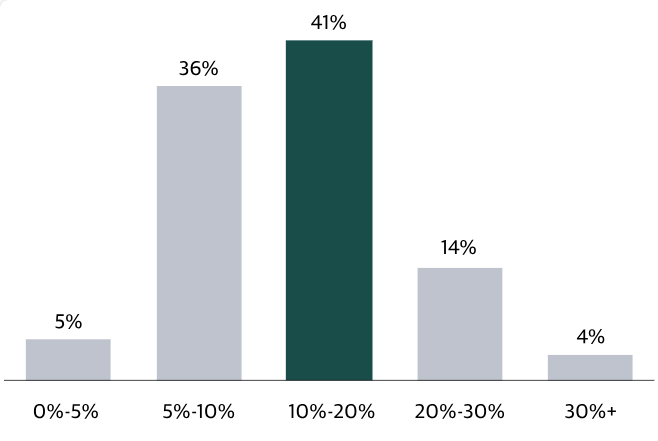
Most advisors recommend higher private market allocations
What is the optimally sized allocation to private markets in a moderate-risk client portfolio?
Nearly 70% of advisors expect to increase or maintain private real estate allocations
Did you know?
At the beginning of the year, Blackstone saw signs that real estate values were bottoming. We believe we are at an inflection point in the cycle – a view shared by most surveyed advisors.
Are you expecting to change allocations to private real estate in clients’ portfolios over the next 12 months?

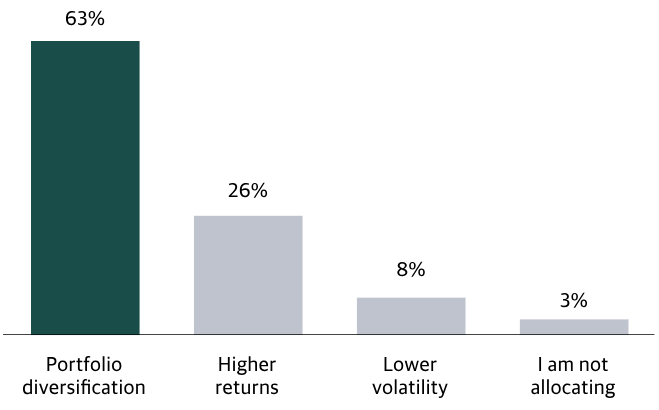
Over 60% of advisors allocate to private equity for diversification benefits
What is the primary reason for adding private equity in clients’ portfolios in the current environment?
Did you know?
Private equity can serve as a core building block for clients seeking diversification and enhanced returns. With elevated public market valuations and unreliable stock-bond correlations, surveyed advisors are increasingly prioritizing investments that enhance portfolio diversification.5
Read previous editions of Advisor Pulse
Education Resources


- Based on surveys of financial professionals across the U.S., EMEA, and APAC participating in Blackstone programming over the period July-September 2024. Average number of respondents per question: 525. Any views or opinions expressed herein reflect solely the views of the advisors who were surveyed in connection with this survey and/or Blackstone, and such views or opinions are subject to change without notice and may differ from opinions expressed by others. Blackstone has not independently verified the information received from the advisors surveyed and no representation is made as to the accuracy of such information. Any projections, expectations or other forward-looking statements set forth herein are based on assumptions that are uncertain and are subject to many factors, changing market conditions and general economic conditions, and may vary materially from the themes set forth herein. Nothing herein constitutes investment advice or recommendations and this summary page should not be relied upon as a basis for making an investment decision.
- Cerulli, “U.S. Wealth Management and Alternative Product Trends,” September 2024.
- UBS, “Global Family Office Report 2024,” data as of 2023.
- Please see Footnote 1.
- Diversification does not assure a profit or protect against losses in a declining market.