Joe Zidle: Corporate Bonds – Priced for Perfection
Here’s a thought: Maybe there isn’t any credit risk left in the corporate bond market. High prices and lack of reward suggest that’s the case. Famed investor and philanthropist Lee Cooperman quipped in a recent CNBC interview that bonds currently represent “return-free risk.”1 The sentiment seems apt. Thanks to government safety nets and highly accommodative monetary policy, spreads in the corporate bond space are back to pre-COVID levels. Compression in high yield bonds recently led to a record low yield of 4.3%.2 For yield, I believe the traditional route isn’t the best answer for investors right now. In my view, they should start to think differently.
Corporations in excellent shape The Federal Reserve’s aggressive policy response to COVID likely prevented a wave of bankruptcies and defaults. And historically low interest rates provided a backdrop for record bond issuance. Companies raised over $2.1 trillion in precautionary cash while reducing interest expense and extending maturities to protect against near-term financing needs. Cash as a percentage of assets on the balance sheet of non-financial companies is at the highest level in at least 50 years.3 As corporate profits have troughed, I expect a bumper earnings crop in 2021.
Such good times don’t last, though Booms and busts in the corporate sector are more frequent than in the economy as a whole. The average length of a profits cycle is measured in quarters, while an economic cycle is measured in years. Figure 1 highlights the default cycle among high yield issuers; you can see that default rates peak during recessions, but they rise in non-recessionary periods, too. And while this cycle is estimated to have a lower peak of default rates, the downside risk of a spike in COVID-related defaults remains.
Figure 1: Historical US High Yield Default Rates
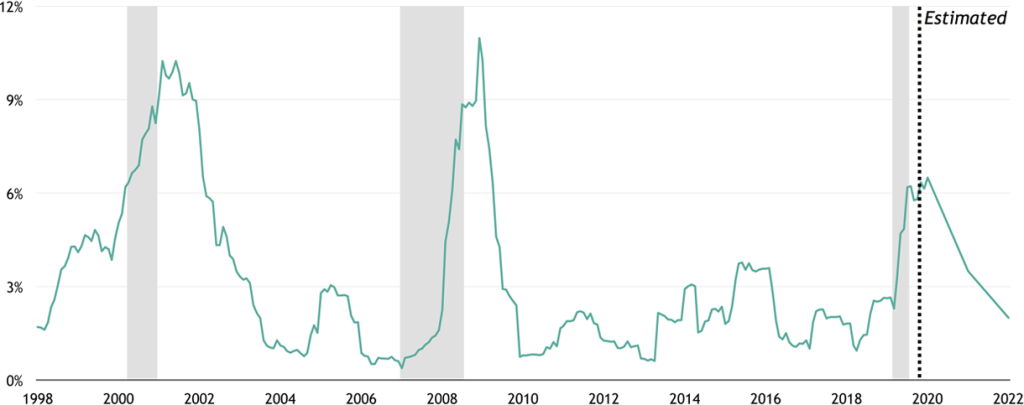
Source: JPM Default Monitor, as of 11/30/20. Represents LTM default rates.
The investor’s dilemma The yield investors receive from traditional corporate bonds deserves attention. As Figure 2 shows, US corporate bond real yields went negative for the first time this year. At negative real rates, investors aren’t paid for interest rate, duration or, most importantly, credit risk, as seemingly benign as it might look today. As a result, they face a difficult choice: accept lower yields from investment grade bonds or go down in quality for more yield.
Figure 2: US Investment Grade Bond Real Yields (bps)
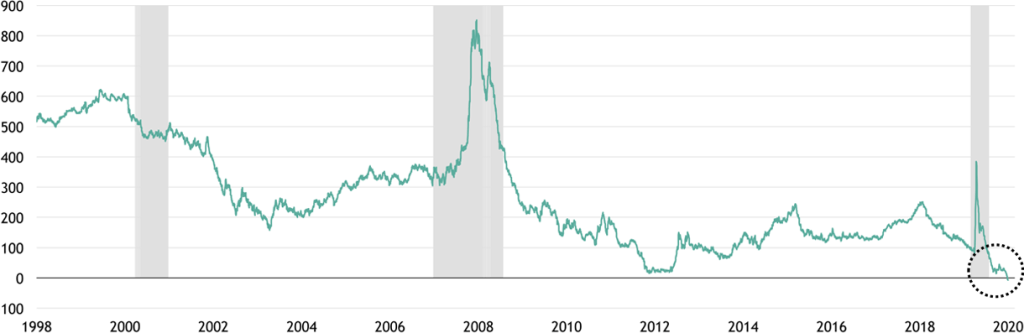
Source: Bloomberg, as of 12/10/20. Represents the Bloomberg Barclays US Corporate Bond Index yield to worst less the US 10-year breakeven inflation rate.
More risk, but even less return Going down in quality should involve a pickup in yield, but even here the compensation is becoming less attractive as the yield pickup of BBB-rated bonds over A-rated bonds is back to pre-COVID levels. The low absolute yields also contributed to a spike in high-yield issuance; the current tally of $406 billion in 2020 YTD is about 57% higher than FY2019.4 As a result, the high yield gross leverage (debt-to-EBITDA) ratio has spiked to 5.8x, in the 85th percentile historically.4
A different path to better returns While investors have fled to riskier and riskier public credits in the hunt for yield, private credit returns remain relatively attractive. Returns in private credit have the potential to be higher for a variety of reasons, including the difficulty in negotiation and structuring the deals, a scarcity of capital as traditional banks have pulled back lending, and the relative difficulty that investors face in accessing private securities. Alternative credit like privately-originated senior secured loans also sits at the top of the capital stack, making it relatively secure. Figures 3 and 4 illustrate this point, showing that private credit historically has loss rates lower than that of senior loans and high yield bonds.
Figure 3: Averaged Realized Loss
(2005-2020)
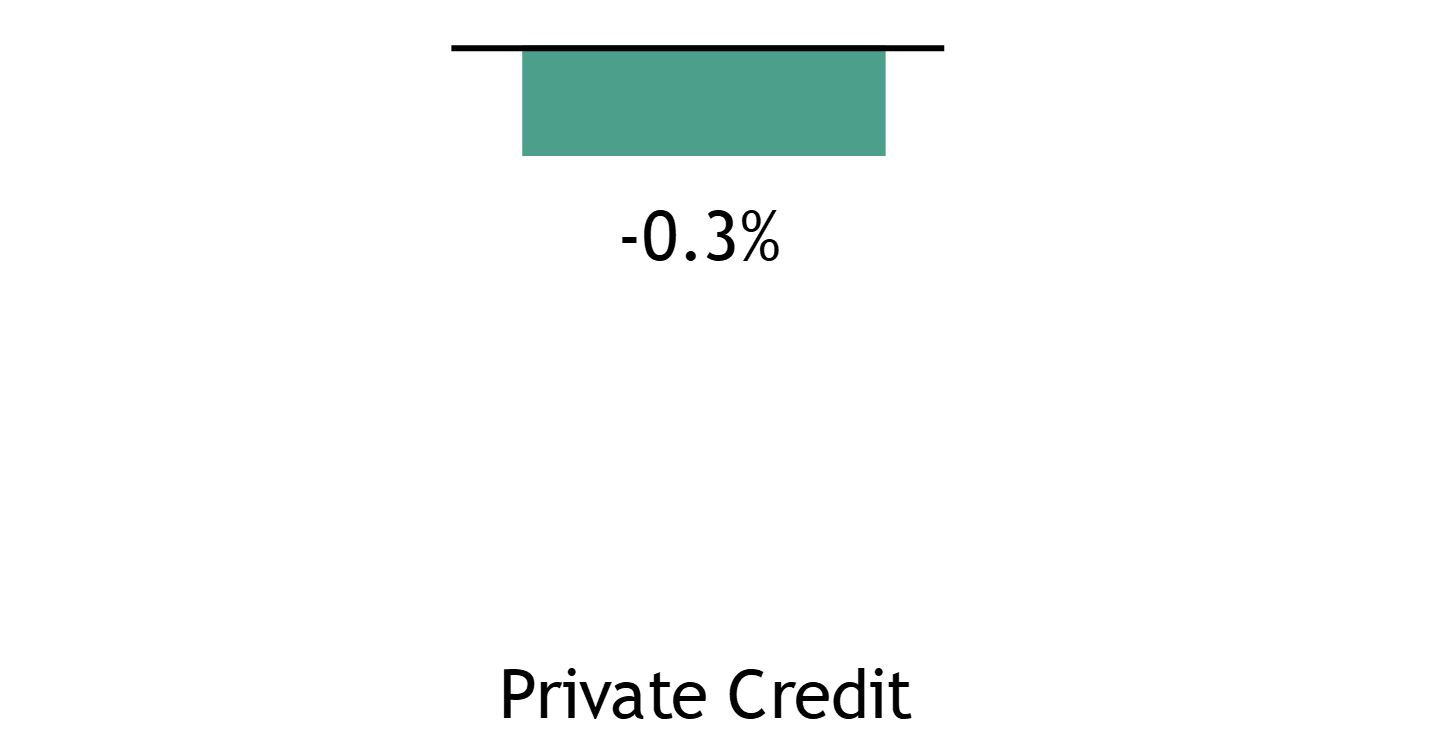
Average realized loss is the historical average of the realized gains/losses for the Cliffwater Direct Lending Index. Source: Cliffwater as of June 30, 2020
Figure 4: Average Loss Rates
(2005 – 2020)
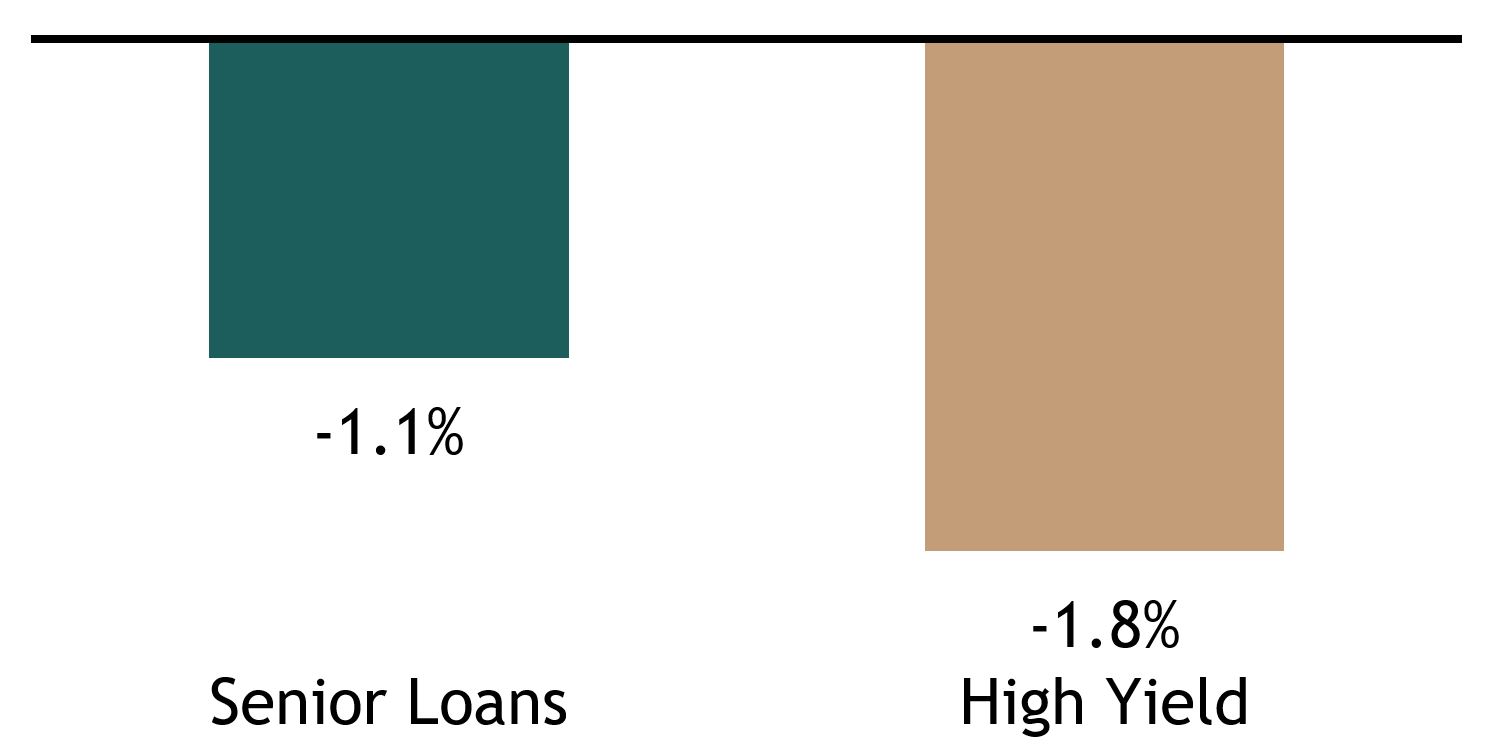
Average loss rate is calculated by taking the default rate * (1 – recovery rate). Source: JPM Default Monitor as of June 30, 2020.
As an asset allocation, I find little reason to own traditional corporate bonds that are priced to perfection in this environment. From where I sit, alternative forms of credit are a more attractive opportunity.
With data and analysis by Taylor Becker.
- CNBC, June 15, 2020.
- Bloomberg, as of 12/7/20. Represents yield to worst for the Bloomberg Barclays US Corporate High Yield Index.
- Federal Reserve, as of 9/30/20. Represents the assets of US nonfinancial corporate business that are classified as checkable deposits and currency, as a share of total assets.
- BofA Global Research, as of 12/4/20.
The views expressed in this commentary are the personal views of Joe Zidle and do not necessarily reflect the views of The Blackstone Group Inc. (together with its affiliates, “Blackstone”). The views expressed reflect the current views of Joe Zidle as of the date hereof, and neither Joe Zidle nor Blackstone undertake any responsibility to advise you of any changes in the views expressed herein.
Blackstone and others associated with it may have positions in and effect transactions in securities of companies mentioned or indirectly referenced in this commentary and may also perform or seek to perform services for those companies. Blackstone and others associated with it may also offer strategies to third parties for compensation within those asset classes mentioned or described in this commentary. Investment concepts mentioned in this commentary may be unsuitable for investors depending on their specific investment objectives and financial position.
Tax considerations, margin requirements, commissions and other transaction costs may significantly affect the economic consequences of any transaction concepts referenced in this commentary and should be reviewed carefully with one’s investment and tax advisors. All information in this commentary is believed to be reliable as of the date on which this commentary was issued, and has been obtained from public sources believed to be reliable. No representation or warranty, either express or implied, is provided in relation to the accuracy or completeness of the information contained herein.
This commentary does not constitute an offer to sell any securities or the solicitation of an offer to purchase any securities. This commentary discusses broad market, industry or sector trends, or other general economic, market or political conditions and has not been provided in a fiduciary capacity under ERISA and should not be construed as research, investment advice, or any investment recommendation. Past performance is not necessarily indicative of future performance.


