Joe Zidle: What Goes Down, Must Come Up
Bueller? … Bueller? The Hawley-Smoot Tariff Act?
It’s the capper to an iconic scene. And unfortunately it’s all too relevant to investors today. Economic and political commentator Ben Stein, playing the world’s most boring history professor in the 1980’s classic Ferris Bueller’s Day Off, launches into a history lesson on tariffs after taking attendance and uttering his famous “Bueller? … Bueller? … Bueller?” line:
“In 1930, the Republican-controlled House of Representatives, in an effort to alleviate the effects of the … Anyone? Anyone? … The Great Depression, passed the … Anyone? Anyone? The tariff bill? The Hawley-Smoot Tariff Act? Which, anyone? Raised or lowered? … Raised tariffs … Did it work? Anyone? Anyone know the effects? It did not work, and the United States sank deeper into the Great Depression.”
That scene’s been stuck in my head in recent weeks, and for good reason. Last month, the trade war with China escalated, ratcheting up volatility in equity and credit risk assets and spurring a flight to safety in Treasury bonds. The new round of tariffs against China goes beyond narrowly-focused goods such as steel, aluminum, and thinly-traded items like nuclear reactors and isotopic separator machines. For the first time in this trade dispute, products that directly touch consumers are now in the crosshairs, as we highlighted in our recent Market Insights piece.
More recently, President Trump threatened Mexico with tariffs, and the implications of this are significant. For the first time in 15 years, in March 2019 the US imported more goods from Mexico than from China.(1) The largest share of Mexican imports includes items used in the manufacturing of vehicles. In turn, the largest US imports from Mexico are automobile-related: car parts, cars, trucks and buses.
As if that wasn’t enough to grind the gears of investors—not to mention car enthusiasts—Trump also announced that tariffs on Indian imports would be implemented soon. India is a smaller trade partner for the US and the tariff levels are as of yet undefined, but that news only added to growing uncertainty in an increasingly multilateral trade war.
Quite simply, the longer the trade conflicts linger, the greater the risk of real damage to the US economy. Stagflation, a toxic combination of slower growth and higher prices, is a risk. Corporate profits being pushed even deeper into negative territory is another. Corporate profits already faced headwinds with year-over-year growth rates hovering near zero. An earnings recession should not be ruled out. Real scenarios exist where China, Mexico and the world face slower growth and disruptions to decades-old supply chains.
Ultimately, we believe that the US will find common ground with China and Mexico. However, a wide-ranging, comprehensive deal with China may elude current negotiators. The key is that we get a deal—comprehensive or incremental—that proves the pressure facing the global economy is transient. Currently, the market expects downgrades to growth estimates, tightening credit conditions and increased volatility in the coming months. At least, that’s what the 10-year Treasury yield is telling us.
But if we are to accept the premise that trade agreements come to pass, and that it’s in the best interests of all involved to make it so, then we must question if the flight to safety from equity and credit risk assets to US Treasury bonds were warranted. We don’t believe that the current status of this multilateral trade war will lead to a US or global recession, or herald the end of this record equity bull market.
For now, investors should expect more volatility for the rest of 2019 as the US and its two largest importing partners harden their positions on trade. As a result, April’s high in equities and low in credit spreads might represent the best performance we see all year in risk assets. Even so, our view is that current yield on the 10-year Treasury, at around 2.1%, is likely to be near its cyclical low, and we expect equities will recover from any corrections it experiences this year.
What to Watch: Yield Curve and Confidence
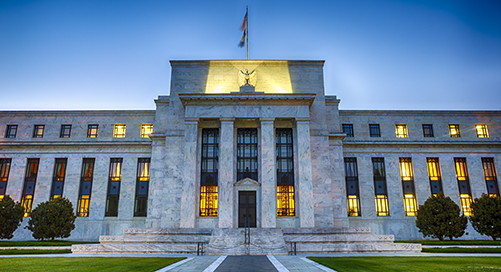
Many investors continue to worry about the inverting yield curve (10-year/3-month Treasuries). What’s important to note is that the curve is currently inverting because the long rate is dropping below the short rate. Typically, it’s the opposite. The Federal Reserve tightens monetary policy, and the short end of the curve rises. That’s not the case right now. This year, the Fed has pivoted away from last year’s tightening conditions and could start easing by the end of 2019. This could be achieved through the reinvestment of bonds held on its balance sheet, or more directly through interest rate cuts.
The current inversion means investors are concerned about a recession this year and want to become more defensive. We, on the other hand, remain optimistic that economic growth will continue this year and next. However, this is based on the assumption that tariffs are a means to an end, versus an end themselves, and that the ultimate outcome of this trade clash is more and freer global trade.
An inversion by the 10-year/2-year portion of the curve would worry us more than the 10-year/3-month. Historically, the 10Y/2Y part of the curve has better predictive powers of economic cycles; once this portion of the curve inverts, a recession generally follows in about 18 months. For the 10Y/3M to provide a robust signal it must invert for 10 consecutive days or there has to be an average inversion of 15bp for some period of time. Inversions without either of these conditions can provide false positives. The same isn’t true with the 10Y/2Y, which as of now remains upwardly sloping.
A drop in CEO confidence would worry us too, because as Economics 101 teaches us, uncertainty is the enemy of growth. Small business CEO confidence, as measured by the NFIB Sales Expectation data, is highly correlated with GDP growth. Small businesses in the US employ approximately 50% of the private workforce, and as their confidence goes, so goes the economy. A drop in sales expectations means that capex and hiring plans get shelved. Overall CEO confidence is also faring well. While off its highs, it remains above the historical average and above all but two readings during the Obama administration.(2)
Beyond Trade, The Fundamentals Aren’t Bad
The world’s two largest economies—the US and China—showed worrisome signs of slowing last year, but conditions in both countries appear to be improving. A better outlook for both countries and India, the seventh-largest and fastest-growing world economy, is good news for global growth.
In the US, key economic indicators appear to have troughed and several influential areas are improving. For example, the Conference Board US Leading Index ticked up in March after five consecutive months of decline. The ISM Semiannual Economic Forecast found that the nation’s purchasing and supply executives have positive expectations for the year, in both the manufacturing and non-manufacturing sectors.(3) Revenues and capital expenditures are expected to increase year-over-year, albeit at a slower pace than the December ISM Forecast had anticipated.
Also, animal spirits still point to optimism for the US growth outlook. Consumer confidence rebounded sharply in May and hit a 15-year high.(4)
This all points to the underlying strength of this expansion, and the 1Q’19 US GDP print is evidence. GDP surprised nearly everyone to the upside, coming in at an annualized 3.1% rate. Several components of the GDP growth may be illusory, such as exports and inventory. However, 2.4% year-over-year productivity growth further supports the overall growth story. In addition, the US economic cycle will be bolstered by 2020 being an election year. We expect President Trump to use every tool in his toolkit to keep the economy booming and at the front of his stump speech on the campaign trail.
As for China, the primary driver of incremental global growth, it is beginning to reap the dividends of its stimulus programs. The People’s Bank of China has taken aggressive action to inject liquidity into its system. China also continues to pursue fiscal and regulatory policies that should jumpstart growth. The recent flare-up in trade tensions all but ensures that China will continue to push for further stimulus.
Like Trump, the leaders of the Chinese Communist Party (CCP) recognize that economic growth is critical to their success. The stakes are much higher for the CCP. The party’s legitimacy—and the social stability that stems from it—has become interwoven with economic prosperity. For this reason, the CCP prioritizes rapid growth and is not shy about positioning the party to receive credit for such growth.
As China recovers from its brief slowdown, its growth should also have pass-through effects. We expect markets with high exposure to the Chinese economy to benefit, including European countries like Germany, whose manufacturing sector is highly sensitive to changes in Chinese demand.
Our base case remains that a deal will be reached by year-end. Trump wants a deal for political reasons as much as China needs it for economic ones. The ultimate risk is that China walks away from the deal, hoping that Trump loses in 2020 and that they get a more amenable negotiating partner.
Growth prospects will certainly suffer so long as this dispute is drawn out, potentially even leading to mini-recessions in highly trade-sensitive sectors such as manufacturing. But these will eventually give way to better economic conditions in 2020. As growth improves, the result will be bullish for risk assets and push 10-year Treasury yields up.
Central Bank Policy: Let’s Kiss and Make Up
Looser monetary policy around the world makes us reluctant to overreact to risks, among which are tariff spats, old and new, and temporarily inverted yield curves. Central banks generally tightened in 2018, even as global growth and leading indicators began to turn down. In fact, 56% of central banks tightened monetary policy last year, resulting in a rare decrease in world monetary supply. In the US alone, the Fed hiked the equivalent of 5.5 times, when accounting for the effects of balance sheet tightening. Many considered the December interest rate hike to be a policy mistake. If they were proven correct, it’s unlikely that the same mistake will be repeated in the short term.
We expect synchronized central bank easing to feature prominently in this extended cycle. Central banks have swung to the other side of the policy pendulum as a result of the would-be recession last year. Bankers from Washington to London and Brussels to Beijing have announced more dovish policies this year. In our view, this is quite bullish for growth and risk assets. Tightening drove the 10-year down, yet this year’s easing has driven yields even lower. Despite the current flight to safety in investor positioning, the 10-year Treasury yield can be expected to go higher given the reversal in central bank policies.

Stagflation Another Risk to Watch
As mentioned earlier, a primary risk to consider is stagflation. Inflation has been incredibly muted this cycle, as evidenced by a steady decline in US Core CPI in 2H’18 and 1H’19. However, due to a variety of factors, inflation may finally be poised for an upside break. Primary contributors include domestic inflationary pressures such as housing costs, and global pressures as the trade dispute disrupts supply chains and increases prices directly for the US consumer. If global growth does weaken, this could create a vicious cycle of declining demand and rising prices.
On the domestic side, shelter costs comprise around 60% of the Core CPI basket and are poised to increase. We expect pent-up demand in the housing markets, unless met by additional supply, will lead to an increase in costs. Mortgage rates are forecasted to decline in 2019 and remain stable through 2021, at the same time that originations are set to increase every year between now and 2021.(5) Ned Davis Research estimates that the US will be short nearly 2.6 million housing units in 2019, driven by strong household formation and Millennials finally entering the housing market in significant numbers.(6)
Rental vacancy rates, at 7% nationwide, are the lowest they’ve been in over three decades, and the homeowner vacancy rate is the lowest it’s been in 17 years.(7) Rental vacancy rates are much lower in urban and metropolitan areas and, in some cases, round down to zero. As the chart below indicates, declining vacancy rates tend to correlate with higher shelter costs. All of this indicates that the housing market is tight and that prices should begin to inch upward, perhaps by 5% per year.

At the same time that domestic inflationary pressures are mounting, the trade dispute is likely to increase upward pressure on prices as well. Of course, there are the potential impacts on supply chains and prices of imported goods, the costs of which have been and will continue to be passed on to consumers. As mentioned though, the newest escalation in a multilateral trade war will now directly affect prices of consumer goods.
For example, the Trump Administration’s threat to impose 25% tariffs on Mexican imports alone are estimated to increase the price of vehicles sold in the US by an average of around $1,300, the costs of which are expected to be picked up by consumers.(8) The upshot of this will be an increase in overall industry pricing. This comes even as new vehicle retail prices hit an all-time high last year, and affordability has taken center stage.(9) Rising prices will likely cause a significant decrease in demand for new vehicles purchases, by some estimates up to 18%.(8) The auto sector is already late-cycle, and this hit to production and sales volumes will cause earnings for this sector to struggle even more amid a harsh corporate profits environment.
Autos are not the only risk. Cell phones and computers are the first and second most important US imports from China, respectively, as a percent of total imports.(10) If global growth does indeed slow, then rising costs for US consumers increases the risk of stagflation, and threatens the continuity of this economic cycle.
Consensus Thinks This Ends Badly—We Aren’t Convinced
Consensus is viewing the risks above from a worst-case scenario. Based on investor positioning, markets are expecting the Fed to cut short-term interest rates, long rates to fall further and the US to enter a recession sometime in early 2020. As evidence of this, investor flows show over $169 billion going into bond funds this year and, according to Morningstar’s fund flows report, the vast majority of this is going into passive, taxable bond funds with longer durations.(11) The 10 funds with the largest inflows have raked in $73 billion thus far this year, with an average effective duration of 6.0 years.(12) On the other hand, the 10 funds with the largest outflows have an average effective duration of 3.7 years.
Investors should prepare for volatility, but any widespread panic is premature. As long as small business confidence remains at elevated levels and the more predictive part of the yield curve remains upwardly sloping, we expect this expansion and bull market to continue. Trade friction is a risk, and it is by no means certain that countries will act in their own economic interests to resolve the issues at hand. But we maintain that every country involved is incentivized to find a solution, and that a deal will eventually come. Now negotiators have to make sure they get it done before it’s too late.
Footnotes:
- Source: Census Bureau, as of 3/31/19. Based on US trade in goods.
- Source: Bloomberg and Chief Executive Magazine, as of 4/30/19.
- Source: Institute for Supply Management, as of 5/8/19.
- Source: Bloomberg and University of Michigan Consumer Sentiment Index, as of 5/17/19.
- Source: Mortgage Bankers Association, as of 3/21/19.
- Source: Ned Davis Research, as of 12/31/18.
- Source: Census Bureau, as of 12/31/18.
- Source: Deutsche Bank Research, as of 6/3/19
- Source: Automotive News, as of 1/15/19.
- Source: Census Bureau, as of 12/31/18. Based on end-use classification.
- Source: ICI and Morningstar Direct, as of 5/15/19.
- Source: Morningstar Direct, as of 4/30/19. Represents the 10 bond funds with largest net inflows/outflows in the Morningstar database, for which average effective duration data is available.
* * * * *
The views expressed in this commentary are the personal views of the author and do not necessarily reflect the views of The Blackstone Group L.P. (together with its affiliates, “Blackstone”). The views expressed reflect the current views of the author as of the date hereof and Blackstone undertakes no responsibility to advise you of any changes in the views expressed herein. For more information about how Blackstone collects, uses, stores and processes your personal information, please see our Privacy Policy here. You have the right to object to receiving direct marketing from Blackstone at any time. Please click the link above to unsubscribe from this mailing list.
Blackstone and others associated with it may have positions in and effect transactions in securities of companies mentioned or indirectly referenced in this commentary and may also perform or seek to perform services for those companies. Investment concepts mentioned in this commentary may be unsuitable for investors depending on their specific investment objectives and financial position.
Tax considerations, margin requirements, commissions and other transaction costs may significantly affect the economic consequences of any transaction concepts referenced in this commentary and should be reviewed carefully with one’s investment and tax advisors. All information in this commentary is believed to be reliable as of the date on which this commentary was issued, and has been obtained from public sources believed to be reliable. No representation or warranty, either express or implied, is provided in relation to the accuracy or completeness of the information contained herein.
This commentary does not constitute an offer to sell any securities or the solicitation of an offer to purchase any securities. This commentary discusses broad market, industry or sector trends, or other general economic, market or political conditions and has not been provided in a fiduciary capacity under ERISA and should not be construed as research, investment advice, or any investment recommendation. Past performance is not necessarily indicative of future performance.